Search for a term on the page by using the search box.

Climate & Climate Change Environmental Mapper

Climate

Climate Change

Climate

Climate is the synthesis of long-term weather patterns in a given area. Climate is distinguished from weather based on the measure of time; weather refers to the day-to-day state of the atmosphere in a region, while climate refers to relatively long periods. Climatic factors such as temperature, wind, humidity, and precipitation continually shape our environment, land, and water resources and how society interacts with them.

Dutchess County is currently located in the northern portion of the temperate climate zone. It has a humid continental climate that is characterized by strong seasonal contrasts and highly variable weather. Major storm systems, which move through the continental United States or up the Atlantic Coast, have a significant impact on the weather. These systems provide ample precipitation for the region, supplemented by tropical, maritime air masses during part of the summer. Winters are strongly influenced by polar air masses from Canada and air masses from the Gulf of Mexico [1].

The relatively close proximity of Dutchess County to the Atlantic Ocean can moderate the climate. Large-scale atmospheric circulation normally dominates the flow pattern near the surface. However, in the absence of strong circulation, the Atlantic can considerably affect local weather patterns, leading to relatively milder winter days and cooler days in the summer. In addition, the area generally has a slightly longer freeze-free season than places at similar latitudes farther inland due to the moderating influence of the ocean.

Moderate temperatures and sufficient precipitation make Dutchess County an excellent location for farming, while seasonal variations help to attract tourists and recreational users. The county's relatively hot summers and cold winters result in substantial heating and cooling costs for homes and businesses.

Temperature is a measure of the internal energy that a substance contains [2]. The county’s mean annual temperature is 50 degrees Fahrenheit, with meteorological winter (December, January, and February) and meteorological summer (June, July, and August) at 28.5 and 70.8 degrees Fahrenheit, respectively [3]. The highest and lowest temperatures ever reported at Poughkeepsie were 107 degrees in July 1966 and 21 degrees below zero in February 1897 [3].

The figure below shows the mean maximum, mean minimum, and mean average temperatures in Dutchess County using Poughkeepsie Airport as the principal reporting station. It is important to note that Dutchess County boasts varied, local Microclimates due to topography and proximity to the Hudson River. For example, areas alongside the Hudson, including Red Hook, Rhinebeck, Hyde Park, Poughkeepsie, and Beacon are generally milder than the rest of the county. Cooler temperatures prevail in higher elevations across the eastern and especially northeastern sections of Dutchess County. Finally, sheltered valleys such as the Harlem Valley also experience cooler conditions, especially at night.

Figure 1: Monthly Climate Normals (1991-2020)- Poughkeepsie Airport, NY (Source: NRCC, CLIMOD system, 2023).

Temperatures at any one place in Dutchess County normally exceed 90 degrees Fahrenheit between 5 and 35 times during the summer. It is uncommon for air temperature to reach triple digits, however, hot temperatures combined with high summer humidity lead to days that feel much hotter. The heat index is the combination of the dew point temperature (the amount of moisture in the air) and the air temperature, and measures how hot it actually feels [2]. Nearly every summer in the county features several hot spells with high temperatures and high humidity leading to extremely uncomfortable and even hazardous conditions. Figure 2 reflects the number of days the maximum temperature exceeded 90 degrees Fahrenheit, using the Poughkeepsie Airport as the principal reporting station.

Figure 2: Number of Days the Maximum Temperature Exceeded 90 degrees Fahrenheit (Source: NOAA NCEI).

Temperatures frequently fall below freezing in the winter. Figure 3 shows the number of days with minimum temperatures less than 32 degrees Fahrenheit, based on data from the Poughkeepsie airport weather station. Note the general decreasing trend in days below freezing over time. On average, temperatures fall below zero degrees 5 to 10 times during the winter, primarily in January and February.

Figure 3: Number of Days the Minimum Temperature Fell Below 32 degrees Fahrenheit (Source: NOAA NCEI).

Degree days are a measure that gauges building energy use for heating or cooling. Days with the average temperature below 65 degrees F are known as heating degree days. For example, a day with an average temperature of 65 degrees or more has zero heating degree days, while a day with an average temperature of 50 degrees has 15 heating degree days (65-50=15 degrees). Temperatures average below 65 degrees in Dutchess County in all months except June, July, and August, so heating degree days are an important index that indicate if spaces need to be heated. As the number of heating degree days increases, so does the use of energy to heat homes and businesses. Poughkeepsie has an annual average of 5,976 heating degree days [3].

Cooling degree days are those with an average temperature above 65 degrees. Poughkeepsie reports 720 annual average cooling degree days [3].

Another type of degree day is Growing Degree Days, which relate plant development and insect emergence to air temperature and indicate which plants may be grown in a particular area. Information about growing degree days is useful to farmers, nurseries, research and extension specialists, and home gardeners. It is especially helpful in crop selection and in determining schedules for planting, pesticide application, and harvesting. For example, most varieties of peas need 1,200 to 1,800 growing degree days (based on a 40-degree F threshold) to reach maturity, so they can usually be grown only in areas that accumulate that many growing degree days or more. The most common threshold temperatures for measuring growing degree days are 40 degrees and 50 degrees F. These are generally accepted as temperatures required for growing economically important plants. When using the 50-degree base, the number of days varies between about 2,000 in the eastern part of Dutchess County to almost 3,000 near the Hudson [3].

The growing season is primarily dictated by the period between the last spring frost and the first fall frost. A frost occurs when surface temperatures fall to 32 degrees F or below [2]. Knowing approximately when the first and last frost will happen and the normal length of the “frost-free” season is critical for determining what types of crops are best suited for a particular area and when they can be safely planted. Generally, the frost-free season in the county lasts from early May through late September or early October. In Poughkeepsie, from a period from 1971 to 2022, the average first frost occurred on October 11th, while the average last frost occurred on May 1st. The average number of frost-free days from that same period falls at 162 days [3].

Precipitation is the process by which water vapor condenses in the atmosphereto form water droplets that fall to the earth as rain, snow, sleet, or hail [2]. The mean annual precipitation in Dutchess County over a 30-year period is 47 inches [3] During the typical growing season, from May to September, the mean precipitation over the last 30 years is 21.4 inches [3]. This is a sufficient amount to support the wide variety of vegetation found in the county. Several short periods of no rainfall are typical during the summer.

Figure 4 shows the total normal monthly precipitation, based on data from the Poughkeepsie Airport Weather Station. Much of the precipitation in the northeastern United States comes from the Gulf of Mexico and the Atlantic Ocean, and is transported by major atmospheric storm systems. These systems develop less frequently during the summer, but local convective activity in the form of thunderstorms produces significant amounts of summer rain.

Figure 4: Monthly Climate Normals at Poughkeepsie Airport, NY. (Source: NOAA NCEI).

Significant differences in precipitation can be observed between various parts of the county. This can be primarily attributed to the topographical profile of the region. The eastern half of Dutchess County receives the most rain due to its higher elevation on the uphill slopes of the Taconic Mountains. As the prevailing northerly and westerly winds reach this area, air is forced upward. As the air rises, it expands and cools. The cooler air cannot hold as much moisture, so the relative humidity increases, leading to the formation of clouds and precipitation. During large storms, total rain or snow will often be greater in these areas due to this effect. The Hudson Highlands have a similar impact on the extreme southern portions of the county. The opposite effect causes lower precipitation in northwestern Dutchess County. As air is transported over the Catskill Mountains, it sinks on the downward-sloping side of the mountains. Sinking air warms and loses moisture, which lowers relative humidity and leads to dry conditions. A rain or snow “shadow” can often be observed in these areas during major storms, resulting in considerably less precipitation.

snow is precipitation in the form of ice crystals, formed from water vapor as it freezes in the air [2]. Dutchess County received a moderate amount of snowfall, with an annual average of 47.1 inches over the last 30 years [3]. Snowfall is variable throughout the county, with higher elevations in the northeast section of the county receiving more snow annually. Storms bringing at least six inches of snow to the region are frequent and normally occur at least once in most winters [3]. The mean monthly snowfall for Poughkeepsie is provided in Figure 5 below.

Figure 5: Annual Total Snow at Poughkeepsie Airport (Source: MOAA NCEI).

Relative humidity is the ratio of the amount of moisture present in the atmosphere to the amount of moisture that the air can hold at any given temperature (expressed as a percent) [2]. The observed mean annual relative humidity in Dutchess County is 76 percent in the morning and 58 percent in the afternoon.

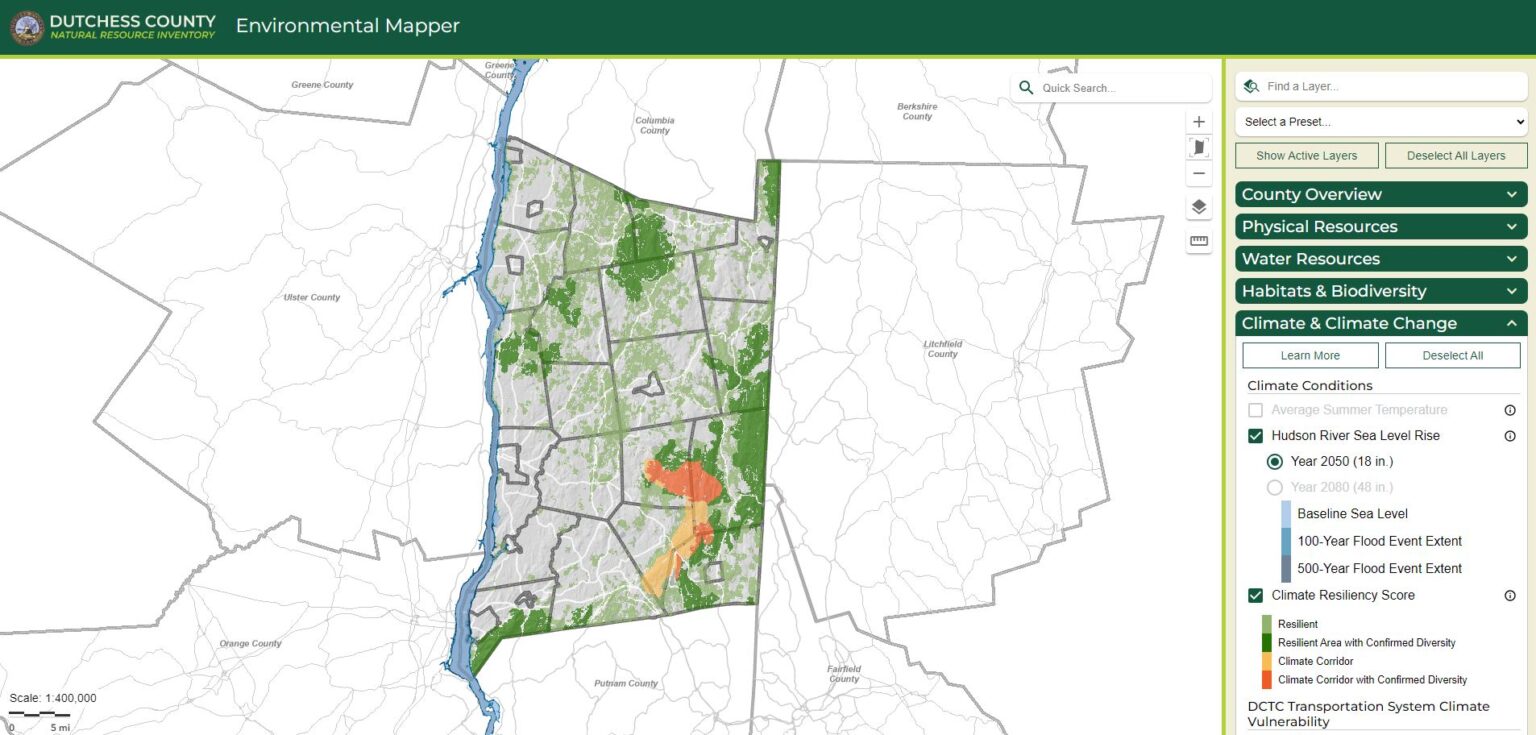
Updating a natural resources inventory helps communities develop a comprehension of where their natural and cultural resources are located, and which resources are significant to a community. The compilation of maps, data, and descriptions within an NRI contributes to a better understanding and appreciation of the community’s natural resources and provides the foundation for a wide range of planning and conservation applications. In particular, the inventory provides the building blocks for land-use and conservation planning and serves as a tool for natural resource information to be included in local planning and zoning.

Atmospheric pressure is the force exerted by the interaction of the atmosphere and gravity [2]. Surface barometric pressure measurements are usually converted to mean sea level pressure, which standardizes the observation so that pressure can be measured on the same scale regardless of altitude. This conversion is done to make pressure readings a useful weather and climate tool.

The mean annual pressure in Dutchess County is about 1017 millibars, or 30.04 inches of mercury. High and low pressure occurs when air descends or ascends. As air warms, it ascends, which leads to low pressure at the surface. The lowest pressure in the county normally occurs during violent weather such as severe thunderstorms and coastal storms. The highest pressure is observed when large high-pressure areas, caused by descending cool air, move over the region bringing fair weather and low humidity. Differences in pressure cause winds in the atmosphere and greater changes in pressure over a given distance, result in stronger winds.

Wind is the horizontal motion of air past a given point. It is caused by differences in air pressure and can also be affected by heating differences of the air and the physical profile of the earth’s surface [2]. Northerly and westerly winds dominate Dutchess County at an average annual velocity of 5.4 miles per hour (MPH). Winds are usually strongest during the winter and early spring, averaging 6-7 MPH. The temperature differences between air masses leads to pressure differences, which produce winds. During the summer months, winds are weaker, on the order of 4-4.5 MPH, and are more southerly.

Under normal atmospheric conditions, winds are strongest during the day and weaken as the sun sets and daytime heating is lost. Severe winds are rare in Dutchess County. Most high wind events are caused by localized, quick-moving severe thunderstorms. Longer, more widespread wind events occur occasionally and are due to larger mid-latitude cyclones such as nor’easters. The strongest and most frequent winds generally come from the west because Dutchess County is located in the westerly wind belt, which can be found at the middle latitudes of the earth. The westerlies are just one of the components of Global circulation patterns.

Thunderstorms, tornadoes, winter storms, hurricanes, floods, and droughts have all impacted Dutchess County. Many of these weather events have caused considerable damage and, in a few cases, proven fatal. The FEMA-approved Dutchess County Hazard Mitigation Plan addresses severe storms, severe winter storms, extreme temperatures, and drought and provides in-depth descriptions of each hazard, including their extent, previous occurrences and the damages caused.

Thunderstorms are relatively common in Dutchess County, primarily during the fall, spring and summer. Thunderstorms can be accompanied by lightning, hail, torrential rains, violent winds, and tornadoes. Most severe thunderstorms occur during the late spring and summer. The National Weather Service defines a thunderstorm as severe if it produces at least one of the following: 1) winds of at least 58 miles per hour, 2) hail at least ¾ inch in diameter, or 3) a tornado. The National Weather Service issues a severe thunderstorm warning if severe thunderstorms are imminent or occurring. Additionally, a severe thunderstorm watch is issued when severe weather is possible but not yet occurring [4]. Between 1971 and 2022 there were 70 large hail (at least ¾ inch diameter) events in Dutchess County, or about one to two per year. Eight of these events reportedly caused property damage, and 3 caused crop damage [5]. Thunderstorms are also capable of producing urban and small stream flooding, uprooting trees, and causing widespread power outages, and damage to structures.

A Tornado is a rotating column of air with a circulation reaching the ground [2]. The intensity of tornadoes is measured by the Fujita Scale, with an F0 being the weakest and F5 the strongest. The Enhanced Fujita Scale is now the standard used to measure the strength of a tornado. It is used to assign tornadoes a rating based on estimated wind speeds and related damage. A rating is assigned with six categories, from EF0 to EF5, representing increasing degrees of damage. Tornadoes are rare but not unheard of in New York State. A total of 16 tornadoes have been reported in Dutchess County since 1950 [5]. All of the tornadoes have been either an F0 or Fl on the Fujita Scale, causing light to moderate damage with winds of up to 110 miles per hour [5]. The National Weather Service issues a tornado warning if Doppler radar indicates the presence of a tornado or if a spotter has sighted one. Additionally, a tornado watch is issued if conditions are favorable for the development of tornadoes [6]. Key atmospheric conditions that lead to a tornado are warm, moist air near the ground, with cooler, dry air lofted with a wind shear. These conditions lead to unstable air masses which promote rotation and the formation of tornadoes [7].

A variety of winter storms can affect Dutchess County. Heavy snowstorms bringing several inches of snow are common. True blizzard conditions in the area are extremely rare since they require strong winds of at least 35 miles per hour and extreme blowing and drifting of the snow [2]. Storms with mixed precipitation often wreak havoc on Dutchess County. Rain, snow, sleet, and freezing rain may all occur as part of the same storm system. Sleet is made up of solid grains of ice which form from the freezing of raindrops or the refreezing of melted snowflakes. These small, transparent ice pellets usually bounce when they hit a hard surface [2]. Freezing rain, however, is precipitation that freezes on contact with the ground [2]. Freezing rain can be especially problematic, as it can lead to black ice as well as downed trees and power lines, which may cause widespread power outages. Dutchess County has experienced three major ice storms since 2008 [5].

A hurricane is a rotating, organized system of clouds and thunderstorms that originates over tropical or subtropical waters. They begin to form over warm water, as low-pressure systems cause hot ocean air to begin to rise in a spiral. As that warm air rises, it releases heat, cools down, and condenses into gusty bands of clouds and storms. The low-pressure area continues to draw up hot, moist air, and the spiral gets stronger and faster. Hurricanes are named when sustained winds reach 74 miles per hour [8]. Tropical Storm are formed the same way, but are weaker systems with sustained winds between 39 and 73 miles per hour [8] . Hurricanes lose strength as they move over cold water or land, but their winds can persist and cause damage, storm surges, and coastal flooding. Hurricanes, tropical storms, and their remnants have occasionally impacted Dutchess County. Between 1950 and 2010, several tropical storms and hurricanes made landfall in New York State. Because Dutchess County is well north of the Atlantic Coast, the primary impacts from tropical cyclones were heavy rain and flooding. In more recent years, Dutchess County was heavily impacted by two hurricanes, Hurricanes Irene and Lee in September 2011 and Hurricane Sandy in 2012. All storms were responsible for widespread flooding, road closures, damage to infrastructure, power outages, and evacuations.

Floods occur with relative frequency in Dutchess County, with roughly three floods of varying degrees reported each year in the county [5]. Each major stream in Dutchess County has a significant number of flood-prone areas and certain areas are prone to annual flooding. The probability of flooding is greatest from December to April due to runoff from rapidly melting snow. Ice flows, an accumulation of broken river ice caught in a narrow channel, frequently produce local floods during spring break-up. Combined with heavy spring rainfall, severe floods can occur in low-lying areas.

Most major floods in Dutchess County are triggered by coastal storms, while some are caused by tropical storms. Hurricanes Irene and Lee brought record-breaking flooding to Dutchess County on the Hudson River in Poughkeepsie and the Wappingers Creek in Wappingers Falls. Moderate flooding occurred on the Tenmile River in the Town of Amenia. Flooding was also reported in the Town of Rhinebeck along Route 9G [9]. A year later, during Hurricane Sandy, the Hudson River rose once more. Storm tides, or the combination of storm surge and astronomical tide rose as high as 9.1 feet in Poughkeepsie, breaking the record from Hurricanes Irene and Lee [10].

Severe nor’easters and other frontal systems also produce floods in the county. In April 2007, an area of low pressure intensified rapidly as it moved from the southern Appalachians to the Long Island coast. The storm brought two days of heavy precipitation, which brought about extensive flooding of small streams and creeks in the county. Record flooding occurred on Wappinger Creek at Wappingers Falls, which crested at 15.06 feet, 7.06 feet above the flood stage of 8.0 feet. Moderate flooding was also recorded along the Ten Mile River at Webatuck, which crested at 11.23 feet. The storm produced three to eight inches of rain throughout the county, including 4.99 inches in Poughkeepsie and 6.83 inches in Rhinebeck [5]. Twenty-four major flood events have been reported in Dutchess County since 1950 [5].

Flash flood is a rapid water level rise in a stream or creek above a predetermined flood level [2]. Flash floods can occur any time of year in Dutchess County. There have been 25 flash floods in Dutchess County since 1950 [5]. Flash flooding occurs most commonly between May and October, and the rain usually occurs because of strong thunderstorms, which can lead to flash flooding. Rapid snowmelt in association with strong precipitation events may also lead to flash flooding during the late winter and early spring. Flash flooding has resulted in millions of dollars of property and crop damage in Dutchess County. Flash flooding was also responsible for a fatality following Hurricane Floyd in 1996 [5].

Drought is a period characterized by long durations of below-normal precipitation [2]. Drought severity is influenced by moisture deficiency, the duration, and the size and location of the affected area. This deficiency in moisture that results in adverse effects on people, animals, or vegetation over a sizeable area. In New York, the Department of Environmental Conservation determines drought status based on a State Drought Index, which evaluates drought conditions by measuring whether indicators like stream flows, precipitation, lake and reservoir storage levels, and groundwater levels reach dire thresholds [11]. The state is divided into 9 drought regions, with Dutchess County falling within Region II [12]. The state can declare four stages of drought; drought watch, drought warning, drought emergency, and drought disaster [11]. The county's major drainage basins have sufficient capacity to sustain some flow even during severe droughts. Serious droughts are rare; brief dry spells are far more common. Dry periods temporarily place crops under stress and often force restrictions in the recreational uses of forested lands because of fire hazards. Mandatory or volunteer water restrictions may also be put in place by local municipalities.

From 2000-2022, National Integrated Drought Information System reported that Dutchess County had abnormally dry periods every year except 2000, 2003, and 2011. Moderate droughts occurred in 2015, 2016, 2017, 2020, 2021, and 2022. Dutchess County also fell into the severe category in the summer of 2022. Severe droughts occurred in 2002, 2012, 2016, 2017, and 2022. Extreme drought occurred in 2016 and 2017 [13]. A full list of known drought events, including FEMA and USDA disasters can be found in the Dutchess County Hazard Mitigation Plan.

Drought can have wide-ranging impacts. Agriculturally, dry conditions can stunt plant growth, and under extreme conditions may cause crop failures. Drought also impacts hydrological resources, like the surface and subsurface water supply. Socially, drought can impact public health by diminishing air quality, influencing the supply and demand of economic goods, and impacting vulnerable populations due to extreme heat [13]. These impacts will be discussed further in the Climate Change Section.

Climate Change

Climate change is defined as any significant change in the measure of climate (such as temperature, precipitation, or wind) lasting for an extended period of time, often decades or longer. Until the advent of the industrial revolution, global climate change occurred over long periods and was caused by a variety of natural factors. However, the International Panel on Climate Change (IPCC), an international body of scientists working through the United Nations, has concluded that the earth’s climate is changing much more rapidly than ever before. Scientists are 90-100% confident that this change is caused by the increase in atmospheric concentrations of greenhouse gases

(GHGs) emitted by humans through the accumulated effects of many activities such as the production, transport, and burning of fossil fuels for electrical power; heating, and powering motor vehicles [14].

Due to the increased combustion of fossil fuels, the current global average atmospheric concentration of carbon dioxide is about 415 parts per million (ppm), the highest level in over 700,000 years [15]. As a result, the global annual average temperature has risen at an alarming rate. Since 1880, the annual average temperature has increased at an average rate of 0.14°F per decade, and over twice that rate (0.32°F per decade) since 1981. Ten of the warmest years on record have occurred since 2010 [15].

Estimates of continued climate change in the future are heavily dependent on the rate of human GHG emissions. If yearly emissions continue to increase rapidly, models project that global temperature will be at least 5 degrees Fahrenheit warmer than the 1901-1960 average by the end of this century. If annual emissions increase more slowly and begin to decline significantly by 2050, models project temperatures would still be at least 2.4 degrees warmer than the first half of the 20th century, and possibly up to 5.9 degrees warmer.

This global temperature increase has brought about noticeable changes to the climate of New York State and Dutchess County, and the effects are likely to be felt more acutely in the coming years— larger and more frequent floods, higher temperatures, and more severe and frequent weather events. People, plants, wildlife, and ecosystems will continue to face severe threats due to climate change.

Temperatures have risen almost 2.5 degrees Fahrenheit in New York State since 1900 [2]. With an average rate of warming of 0.25 degrees Fahrenheit per decade, historically unprecedented warming is expected to continue during this century based on projected emissions [16].

New York State Department of Environmental Conservation’s 2014 publication Responding to Climate Change in New York State (ClimAID) includes air temperature projections for Dutchess County, which falls within Region 5 in this report. The report predicts a rise in annual average temperature as outlined in the table below with summarized projections for the 2020s, 2050s, 2080s, and 2100.

Table 1: Air Temperature Projection for Dutchess County

Baseline (1971-2000)  2020s  2050s 2080s 2100
Annual average air temperature 52.2.-53.1˚F 54.2-56.1˚F 55.4 - 59.6˚F 56.2 - 61.2˚F
Increase in annual average 2.2 - 3.1˚F 4.2 - 6.1˚F 5.4 - 9.6˚F 6.2 - 11.2˚F

Source: Adapted from NYS DEC, Observed and Projected Climate Change in New York State, 2021 and Cornell’s New York State Water Resources Institute

For reference, the average annual temperature recorded at the Poughkeepsie Airport in 2022 was 51.7 degrees Fahrenheit, slightly below projections included in the report [3]. Continued warming will drastically impact Dutchess County, affecting ecosystems, agriculture, public health, and the economy.

In New York State, winters are warming faster than any other season. Average winter temperatures over the last century have increased by approximately 3°F, spring temperatures by 2°F, and summer and fall temperatures by 1.4°F [17]. Figure 1 shows the observed number of days that the minimum temperature fell below 32 degrees Fahrenheit, or freezing, from 1950 to 2022 in Poughkeepsie. It shows a downward trend in the number of days below freezing over that time period.

Figure 1: Number of Days with a Minimum Temperature Less Than 32 Degrees Fahrenheit. 

Warmer temperatures are already impacting Dutchess County’s ecosystems by altering the winter to spring seasonal transition and bringing more winter precipitation as rain, reducing snow cover and causing earlier snowmelt in the spring. Many species of wildlife depend on snowpack as a means to avoid predators in the winter. Seasonally changing temperatures will also result in increased impacts on species’ breeding patterns and migration patterns. Earlier bloom times of plants also impact wildlife’s food sources. The health of the County’s 56% forested lands also faces potential impacts. Warm temperatures can expand the range of interfering vegetation and invasive insect species. Individual tree species will also respond differently to changing temperatures, potentially shifting species distribution  and changing how forests look and function [18].

Extreme temperatures are also predicted to affect the County’s agricultural systems by causing dry conditions and worsening drought [16]. Dry conditions can stunt plant growth and delay planting of crops. To combat dry conditions, farmers will need to use increased irrigation. In instances of moderate and severe drought, yield and fruit size of specialty crops, hay, and grain yield can be impacted. Feeding livestock will become more difficult, and under conditions of extreme drought, farmers will begin to struggle financially [13]. Impacts on agriculture may ultimately cause a rise in food costs, impacting the county and beyond. Warmer winters will also impact the length of the typical growing season. Fewer frost days (days with temperatures below 32 degrees Fahrenheit), will lengthen the growing season. While this may seem to be an advantage to farming, a longer growing season impacts crop selection and determines schedules for planting, pesticide application, and harvesting. A seasonal shift may impact which crops remain economically viable in the area. Warmer and longer growing seasons encourage invasive species, weeds, and crop diseases.

Seasonal shifts will also impact home and business heating costs. With the advent of climate change, the number of degree days each year has changed due to warming temperatures. The number of cooling degrees has gradually increased during the past 60 years, including a record 1,049 in Poughkeepsie during 2005. Similarly, the number of heating degree days has decreased over the same period. In 2016, there was a record low of just 4,777 heating degree days in Poughkeepsie, compared to the annual average of 6183 days since 1947 [3]. Extreme heat has been found to be associated with increased incidence of mortality, especially among vulnerable populations. In the past decade, The United States saw heat-related mortalities ranked the highest among weather-related fatalities. Many of those deaths occurred from exposure to outdoor extreme heat or exposure indoors among those who had little or no access to air conditioning [19]. Climate change brings other risks to public health. Shorter winters may also facilitate the spread of disease, especially from tick borne and other insect-vectored illnesses such as Lyme disease and Zika virus [20].

Extreme temperatures also have the potential to increase the risk of wildfires. Dutchess County saw several wildfires in the 2020s, with several in 2022 as most of the county experienced varying degrees of drought conditions throughout the summer [5]. In addition to potential damage to property and human life, wildfires also diminish air quality [13].

Dutchess County is likely to experience an increase in the intensity and the frequency of extreme precipitation events due to climate change. Heavy precipitation refers to instances when the amount of precipitation received substantially exceeds what is normal for that location. It is predicted that this trend will continue into the future, bringing frequent events with multiple inches of rain and severe downpours [21].

New York State Department of Environmental Conservation’s 2014 publication Responding to Climate Change in New York State (ClimAID) includes precipitation projections for Dutchess County, which falls within Region 5 in this report. The report predicts a rise in precipitation over time, summarized in Table 2 below.

Table 2: Precipitation Projections for Dutchess County
Baseline (1971-2000) 2020s 2050s 2080s 2100
Total annual precipitation 51" 52" - 54.5" 53" - 57" 53.5" - 58.5" 53.5" to 61.5"
% Increase in annual precipitation - 2 - 7% 4 - 12% 5 - 15% 5 - 21%
# Days with precipitation > 1" 10 14 - 15 14 - 16 15 - 17 *
# Days with precipitation > 2" 1 3 - 4 4 4 - 5 *

*Projections not available at this time

Source: adapted from NYS DEC, Responding to Climate Change in New York State (ClimAID), 2014 and Cornell’s New York State Water Resources Institute

More frequent and extreme rain events will impact the county by increasing flooding events, resulting in damage to personal homes and property, as well as roads, bridges, and other critical infrastructure. Urban areas are particularly vulnerable to flooding due to heavy precipitation as they typically have more impermeable surfaces like roads and buildings [16]. Low-lying areas and those along the Hudson and its tributaries would also continue to be susceptible to flooding.

Heavy rainfall can also contribute to water pollution by washing sediment and chemicals from roadways into nearby water bodies. This could overwhelm county and municipal stormwater and sewage treatment systems that overflow into water bodies. Nutrient runoff from fertilized lawns and septic systems following more frequent heavy rainfall events has led to an increase in harmful algal blooms (HABs) in water bodies. HABs are occurring more often and lasting longer throughout the year. Algal blooms are harmful to humans, animals, fish, and shellfish populations [22].

Impacts to agriculture can also be expected. Wetter growing seasons can affect crop production, causing financial stress to farmers and disruptions to food chain supply and food costs. Farmlands also face flooding risks in extreme precipitation events.

As a county bordered by the tidal extent of the Hudson River, Dutchess County can expect to see impacts from sea level rise due to climate change. Since 1880, sea level has risen along New York’s coast by about 13 inches. This is more than the global average of 7-8 inches. Levels along the coast of New York will likely be higher than the projected global sea level rise due to local and regional factors, like topography and general climatic and meteorological patterns. Sea level rise will increase the frequency, extent, and severity of coastal flooding, which is a grave risk to tidal communities along the Hudson River [15].

New York State Department of Environmental Conservation’s 2014 publication Responding to Climate Change in New York State (ClimAID) includes sea level rise projections for the Hudson River in Dutchess County, which falls within Region 5 in the report. The report predicts an additional 5-7 inches in sea level rise by the 2050s. Additional predictions for the 2020s, 2050s, 2080s, and 2100s are summarized in the table below.

Table 3: Sea Level Rise Predictions for Dutchess County.

Baseline (1971-2020) 2020s 2050s 2080s 2100 Mid-Hudson Region 1-9” 5-27” 10-54” 11-71"

Source: adapted from NYS DEC, Responding to Climate Change in New York State (ClimAID), 2014 and Cornell’s New York State Water Resources Institute

Dutchess County has already experienced flooding impacts, as described in the Floods and Flash Flooding sections of the Base Climate section. Sea level rise will likely exacerbate flooding issues throughout the county, especially near the Hudson and its tributaries. The combined effects of sea level rise, tidal flow, and storm surges will likely cause major disruptions to those in proximity.

Dutchess County is most densely populated along the Hudson River. Increased flooding due to sea level rise will directly impact the public safety of those in current and projected flood zones. Flooding may cause direct health impacts due to injury and drowning, and can have a wide range of indirect impacts such as diminished water and food supply and quality, interruption of healthcare service delivery, mental health consequences, and respiratory responses to indoor mold [3].

Critical transportation infrastructure also faces risk. Many of the County’s major road segments, bus routes, and passenger rail lines fall within existing flood zones. As flood extents increase, so do the barriers to safe passage and basic needs when roads close and public transportation systems are unable to function [3].

Other critical infrastructure within the county is located near the Hudson and in flood zones. Emergency facilities, schools, senior facilities, wastewater systems, potable water storage are examples. It is estimated that flooding in Dutchess County will continue to cause infrastructure deterioration or failure, utility failures, power outages, water quality and supply concerns, and transportation delays, accidents and inconveniences [9].

Natural ecosystems like wetlands help to buffer inland areas from storm surge events. As sea levels continue to rise, these wetland ecosystems must adapt by moving inland or raising vertically or they risk becoming submerged and destroyed. The rapid rate of sea level rise and accelerating coastal development are limiting how much these natural communities are able to adapt. Losing these systems increases the vulnerability of New York communities to climate change [3].

Changes to Dutchess County’s climate will be more extreme if human greenhouse gas emissions (GHGs) continue unabated or increase into the future. Climate change will have far-reaching effects on many sectors. New York State, Dutchess County, and other organizations and businesses around New York have begun ongoing efforts to mitigate climate change, or to reduce their emissions of GHGs.

On July 18, 2019, the Climate Leadership and Community Protection Act (Climate Act) was signed into law. New York State’s Climate Act is among the most ambitious climate laws in the nation and requires New York to reduce economy-wide greenhouse gas emissions 40 percent by 2030 and no less than 85 percent by 2050 from 1990 levels [23]. The Climate Act also requires State agencies, authorities, and entities to direct funding in a manner designed to achieve a goal for disadvantaged communities to receive 40% of overall benefits of spending on clean energy and energy efficiency programs. To meet the law’s goals and requirements, a final Scoping Plan report was produced in December of 2022 under the direction of a 22-member Climate Action Council. These goals will eventually translate down to policies, incentives, and further regulations that will impact New Yorkers at the most local level [23].

In addition to State initiatives, Dutchess County, along with nine of its municipalities, will participate in a collaborative working group throughout 2023 to complete individual government operations greenhouse gas inventories and climate action plans that will outline emissions reduction targets, strategies, and projects [24]. This process may inform future laws and policies to meet emissions targets.

Even with efforts to reduce greenhouse gas emissions, adaptation to climate change impacts is necessary now and for the future. Planning for the changes that will occur and considering the future risks of climate change will be critical for decision makers. Those involved in agriculture, insurance, transportation and many other sectors must be cognizant of the latest climate change information and future projections. Reducing our vulnerability to climate change will require changes to our economy and infrastructure, as well as individual attitudes, societal values, and government policies to ensure the stability of both human and natural systems.

Dutchess County decisions makers will need to consider the State’s Community Risk and Resiliency Act (CRRA), which requires applicants for permits or funding in certain programs to demonstrate that future physical climate risk due to sea-level rise, storm surge, and flooding had been considered in project design and that DEC considers incorporating these factors into certain facility-siting regulations. The Climate Act amended CRRA to include an expanded scope that must consider all future climate hazards, not only sea level rise, storm surge, and flooding, for applicable programs. Guidance for CCRA has been made available, including;

A guide for using natural resilience measure to conserve, restore, or mimic natural processes to reduce climate risks: Using Natural Measures to Reduce the Risk of Flooding.

State Flood Risk Management Guidance, which recommends flood—risk management guideline elevations that incorporate future climate scenarios.

New York’s Department of State created model local laws to help local governments be more resilient to sea-level rise, storm surge, and flooding. This guidance, titled Model Local Laws to Increase Resilience, provides measures for wetland and watercourse protection, coastal shoreline protection, management of floodplain development, and stormwater control, as well as highlighting basic land use tools for resiliency. Local governments are invited to adapt model local laws to meet the resilience needs of the community with the assistance of their attorneys (NYS Department of State).

Dutchess County is actively working on long-term infrastructure planning that takes a changing climate into account. The Dutchess County Transportation Council produced a digital, 25-year strategic vision for improving transportation in the county, called Moving Dutchess Forward. This plan considers how climate trends, such as rising temperatures, more extreme weather, increasing precipitation, more flooding events, and sea level rise will impact transportation systems and the populations that they serve. This will be expanded on in an anticipated transportation climate vulnerability assessment, called Resilient Ways Forward, to be completed by Dutchess County Transportation Council and partners in 2024. The assessment will identify locations where the transportation system is most vulnerable to the impacts of climate change, such as flooding, extreme temperatures, and wind. It will also recommend ways to adapt to or reduce the adverse impacts of climate change on the transportation system – which includes roads and bridges, buses and trains, sidewalks, rail trails, and other strategic transportation assets, and touches state, regional, county, and local agencies alike.

[1] Great Lakes Integrated Sciences and Assessments (GLISA). “Hudson Valley - NY05.” Accessed 2023.
[2] National Oceanic and Atmospheric Administration (NOAA). “Full Weather Glossary.” National Weather Service, Accessed 2023.
[3] Northeast Regional Climate Center (NRCC). “CLIMOD 2.” Northeast RCC CLIMOD 2, Accessed 2023.
[4] National Oceanic and Atmospheric Administration (NOAA). “Understand Severe Weather Alerts.” National Weather Service, Accessed 2023.
[5] National Oceanic and Atmospheric Administration (NOAA). “Storm Events Database.” National Centers for Environmental Information, Accessed 2023.
[6] National Oceanic and Atmospheric Administration (NOAA). “National Weather Service New York, NY Watch Warning Advisory Definitions Page.” National Weather Service, Accessed 2023.
[7] National Weather Service. “About Tornadoes.” Accessed 2023.
[8] National Oceanic and Atmospheric Administration (NOAA). “National Hurricane Center and Central Pacific Hurricane Center.” Accessed 2023.
[9] Dutchess County Department of Emergency Response. “Dutchess County Hazard Mitigation Plan.” 2016.
[10] Eric S. Blake, Todd B. Kimberlain, Robert J. Berg, John P. Cangialosi and John L. Beven II. “Tropical Cyclone Report Hurricane Sandy.” National Hurricane Center, 12 February 2013 .
[11] New York State Department of Environmental Conservation (NYS DEC). “Drought.” Accessed 2023.
12] New York State Department of Environmental Conservation (NYS DEC). “New York State Drought Management Regions.” Accessed 2023.
[13] National Integrated Drought Information System (NIDIS). “Drought Conditions for Dutchess County.” Accessed 2023.
[14] Intergovernmental Panel on Climate Change (IPCC). “Climate Change 2021: The Physical Science Basis.” IPCC Sixth Assessment Report, Accessed 2023.
[15] National Oceanic and Atmospheric Administration (NOAA). “State Summaries 2022, New York.” National Centers for Environmental Information, Accessed 2023.
[16] New York State Energy Research and Development Authority (NYSERDA). “Responding to Climate Change in New York State (ClimAID).” 2014. Accessed 2023.
[17] United State Environmental Protection Agency. “Climate Change Indicators: Seasonal Temperature.” Accessed 2023.
[18] United States Department of Agriculture Climate Hubs. “Explore Climate Impacts.” Climate Change Response Network, Accessed 2023.
[19] Nayak et al., “Development of a heat vulnerability index for New York State.”Public Health, Volume 161, 2018, Pages 127-137, ISSN 0033-3506, https://doi.org/10.1016/j.puhe.2017.09.006.
[20] Rocklöv, J., Dubrow, R. “Climate change: an enduring challenge for vector-borne disease prevention and control.” Nat Immunol 21, 479–483 (2020). https://doi.org/10.1038/s41590-020-0648-y
[21] New York State Department of Environmental Conservation (NYS DEC). “Observed and Projected Climate Change in New York State: An Overview.” August 2021
[22] New York State Department of Environmental Conservation (NYS DEC). “Climate Change Effects and Impacts.” Accessed 2023. [23] New York State. “Climate Act.” Accessed 2023
[24] New York State Regional Economic Development Councils. “Dutchess County Climate Action Planning Institute (CAPI).” Accessed 2023.

Atmosphere: The air surrounding and bound to the Earth.

Atmospheric pressure: The pressure exerted by the earth's atmosphere at any given point, determined by taking the product of the gravitational acceleration at the point and the mass of the unit area column of air above the point.

Climate: The composite or generally prevailing weather conditions of a region, throughout the year, averaged over a series of years.

Climate change: Non-random change in climate that is measured over several decades or longer. The change may be due to natural or human-induced causes.

Degree Days: A measure that gauges the amount of heating or cooling needed for a building using 65 degrees as a baseline. Electrical, natural gas, power, and heating, and air conditioning industries utilize heating and cooling degree information to calculate their needs

Dew point: A measure of atmospheric moisture. It is the temperature to which air must be cooled in order to reach saturation (assuming air pressure and moisture content are constant). A higher dew point indicates more moisture present in the air. It is sometimes referred to as Dew Point Temperature, and sometimes written as one word

Drought: A deficiency of moisture that results in adverse impacts on people, animals, or vegetation over a sizeable area.

Flash flood: A rapid and extreme flow of high water into a normally dry area, or a rapid water level rise in a stream or creek above a predetermined flood level, beginning within six hours of the causative event. Ongoing flooding can intensify to flash flooding in cases where intense rainfall results in a rapid surge of rising flood waters.

Flood: Any high flow, overflow, or inundation by water which causes or threatens damage.

Freezing rain: Rain that falls as a liquid but freezes into glaze upon contact with the ground.

Global circulation patterns: The worldwide system of winds by which the necessary transport of heat from tropical to polar latitudes is accomplished.

Greenhouse gases: The gases that absorb terrestrial radiation and contribute to the greenhouse effect; the main greenhouse gasses are water vapor, methane, carbon dioxide, and ozone.

Harmful Algal Blooms: Also known as “HABs.” These are an occurrence when algae (simple photosynthetic organisms that live in the sea and freshwater) grow out of control while producing toxic or harmful effects on people, fish, shellfish, marine mammals, and birds.

Heat index: Also known as the “apparent Temperature, the heat index is an accurate measure of how hot it really feels with the relative humidity added to the actual air temperature.

Hurricane: A tropical cyclone in which the maximum 1-minute sustained surface wind is 64 knots (74 mph) or greater.

Maritime air masses: An air mass influenced by the sea. It is a secondary characteristic of an air mass classification, signified by the small "m" before the primary characteristic, which is based on source region. For example, mP is an air mass that is maritime polar in nature. Also known as a marine air mass.

Microclimates: The climate of a small area such as a cave, house, city or valley that may be different from that in the general region.

Precipitation: The process where water vapor condenses in the atmosphere to form water droplets that fall to the Earth as rain, sleet, snow, hail, etc.

Relative humidity: The amount of atmospheric moisture present relative to the amount that would be present if the air were saturated. It is a function of both moisture content and temperature.

Sea level rise:The increase currently observed in the average sea level trend as a result of many interacting processes.

Sleet: Pellets of ice composed of frozen or mostly frozen raindrops or refrozen partially melted snowflakes. These pellets of ice usually bounce after hitting the ground or other hard surfaces.

Snow: Precipitation in the form of ice crystals, mainly of intricately branched, hexagonal

Thunderstorms: A local storm produced by a cumulonimbus cloud and accompanied by lightning and thunder.

Tornado: A violently rotating column of air, usually pendant to a cumulonimbus, with circulation reaching the ground. It nearly always starts as a funnel cloud and may be accompanied by a loud roaring noise.

Tropical Storm: A tropical cyclone in which the maximum 1-minute sustained surface wind ranges from 34 to 63 knots (38 to 73 mph).

Weather: The state of the atmosphere with respect to wind, temperature, cloudiness, moisture, pressure, etc. Weather refers to conditions at a given point in time (e.g., today's high temperature), whereas climate refers to the "average" weather conditions for an area over a long period of time (e.g., the average high temperature for today's date).