Water Resources
Water is a vital resource as drinking water and an essential component of habitat suitability for a wide array of aquatic organisms. In addition to these direct uses, the movement of water throughout the atmosphere, surface streams and lakes, and aquifers carries both necessary materials (such as dissolved oxygen and nutrients) and harmful materials (such as pollutants). The amount of water as well as quantity of material in transport will be affected by a host of natural factors including soils, vegetation, and underlying geology, along with numerous human activities such as direct discharge of wastes into surface waters and modification of land cover within watersheds. Water use must be balanced between amounts required to allow aquatic ecosystems to function and prudent use for drinking, manufacturing, and waste disposal. Setting this balance presumes a solid understanding of the amounts of water available, how it moves through various flow paths across and under the landscape, and the natural and societal requirements for water.
Water is a finite resource from a global perspective. Less than one percent of the total water on the planet is freshwater, with oceans and ice masses making up the vast majority. Water is continuously recycled through the hydrologic cycle. Within this cycle, water enters the atmosphere by evaporating from oceans and other large water bodies and by transpiration from plants. This water vapor condenses into clouds and eventually falls back to earth as precipitation in the form of rain, snow, sleet, or hail. Some of the water that falls on the land surface will evaporate or be transpired by plants. The rest will run off into streams and rivers or infiltrate into underground water storage areas, called aquifers, where it can be tapped for human use. Some may find its way into deep aquifers through cracks in the underlying bedrock, where it may be stored for centuries before working its way to the surface to evaporate, thus closing the cycle.
Human activity can have a profound impact on this natural cycle, and the largest scale effect has been our alteration of global climate which many predict will alter amounts of precipitation snow cover and rates of evapotranspiration due to warmer temperatures in the northeastern United States. See the Climate Change section for more information. Once water falls on the land surface, the proportion that infiltrates versus runs off will be affected by the landcover, with the most dramatic effects due to conversion of vegetated areas to impervious cover such as roads, parking lots, and rooftops. Aside from affecting the quantity of water moving through various pathways, human activities can alter the substances carried in the water with some of the best studied examples including acid deposition and nutrient enrichment of surface and groundwaters.
Groundwater & Aquifers
Groundwater in the Hydrologic Cycle
Groundwater encompasses the water flow in the hydrologic cycle which moves beneath the earth’s surface. Groundwater recharge occurs when local precipitation enters soil and rock horizons and infiltrates down to subsurface depths where the sediment porosity or bedrock fractures are already saturated from prior precipitation events. The boundary between unsaturated and saturated geologic materials is called the water table. Below the water table, any geologic formation containing useful quantities of groundwater is recognized as an aquifer. Aquifers can consist of sand and gravel formations or fractured bedrock. Since residential wells providing useful quantities of water have been drilled in every bedrock formation in the county, all of Dutchess County’s bedrock formations are recognized as aquifers, although some are lower yielding than others. Sand, gravel, and even some silt deposits in Dutchess County’s valleys have long been utilized for the installation of water wells, so these formations are also recognized as aquifers. Approximately 381 million gallons of replenishable groundwater recharge county aquifers each day, equivalent to approximately 1,287 gallons daily per capita based on the 2020 census data for Dutchess County.
Rates of groundwater recharge into aquifers are primarily limited by the general porosity (amount of void volume within a volume of soil or fractured bedrock) of Dutchess County’s soils, with higher recharge rates possible in areas with sandy soils and lower recharge rates occurring in areas with silty or clayey soils. The Soil Conservation Service assigns all soils into one of four major Hydrologic Soil Groups (HSG). HSG A soils are generally the sandiest soils, HSG B soils consist of mixed silt and sand, HSG C soils are silty, and HSG D soils are clay-rich soils. A Dutchess County Aquifer Recharge Rates & Sustainable Septic System Density study [1] identifies average annual recharge rates identified for each Hydrologic Soil Group in the county’s major watershed areas. The highest recharge rates occur in areas with sandy soils and higher precipitation rates; the lowest recharge rates occur in areas with low precipitation rates and clayey soils. The recharge rates identified on were calibrated to stream flows of the Wappinger Creek, Tenmile River, and the Fishkill Creek. The distribution of Hydrologic Soil Groups in Dutchess County is discussed in the Soils Section. Most soils in Dutchess County fall in Hydrologic Soil Groups B and C.
Once recharge from precipitation reaches the water table, it no longer flows directly downward since all available pore spaces are already occupied by prior water. Groundwater then migrates downhill through the openings in granular soils or through networks of interconnected fractures in otherwise solid rock formations, flowing toward lower-elevation areas in the watershed, where it eventually exits the subsurface in springs or by emerging in the beds of streams, rivers, or wetlands. It is helpful to think of groundwater flow as “subsurface runoff,” with the slope of the water table generally mirroring the topography of the landscape in a muted way. Rates of subsurface runoff are far slower than surface water runoff because groundwater flow is obstructed by the complexity and constriction necessitated by flow though fractures and pores. Groundwater flow is therefore usually measured at rates less than one foot per day.
The emergence of groundwater in surface water bodies and wetlands is recognized as base flow, available as an important component of streamflow year-round and particularly critical to wetland vegetation and stream flows during extended dry periods. In most hillside and upland areas in Dutchess County, the water table lies between 20 and 30 feet below the land surface. Perennial streams, rivers, lakes, and wetlands exist where the land surface and the water table converge.
Groundwater can be considered “in transit,” continuously migrating slowly through aquifers. This slowly migrating water can be accessed using wells drilled to intersect the fractures containing slowly moving groundwater or using wells with screens positioned in sand and gravel containing groundwater moving slowly towards streams. The travel period between when precipitation first enters an aquifer to when it exits in a stream or riparian wetland may be measured in weeks to months, and sometimes even years. It is important to recognize that groundwater is not permanently stored – rather it is simply delayed drainage available to support a host of uses. These uses include human uses where wells are drilled into aquifers, and a host of natural uses including vegetative use by plants with deep root systems, shallow vegetative uses by wetland vegetation, and aquatic uses where groundwater exits aquifers to move into our streams. Groundwater resource management includes allocation decisions among competing uses for this water.
Aquifers and Groundwater Quantity
Although groundwater is sometimes locally scarce due to low-yield geologic formations or over-pumping, there appears to be sufficient groundwater in Dutchess County, limited only by withdrawal techniques and distribution system limitations. Compared with many parts of the United States and globally, the county’s precipitation rates and average recharge rates are generous and offer development and quality-of-life advantages unavailable to many communities. More than half of the county’s population relies on community wells or individual wells. Wells also serve as backup or auxiliary supplies for another significant percentage of county residents.
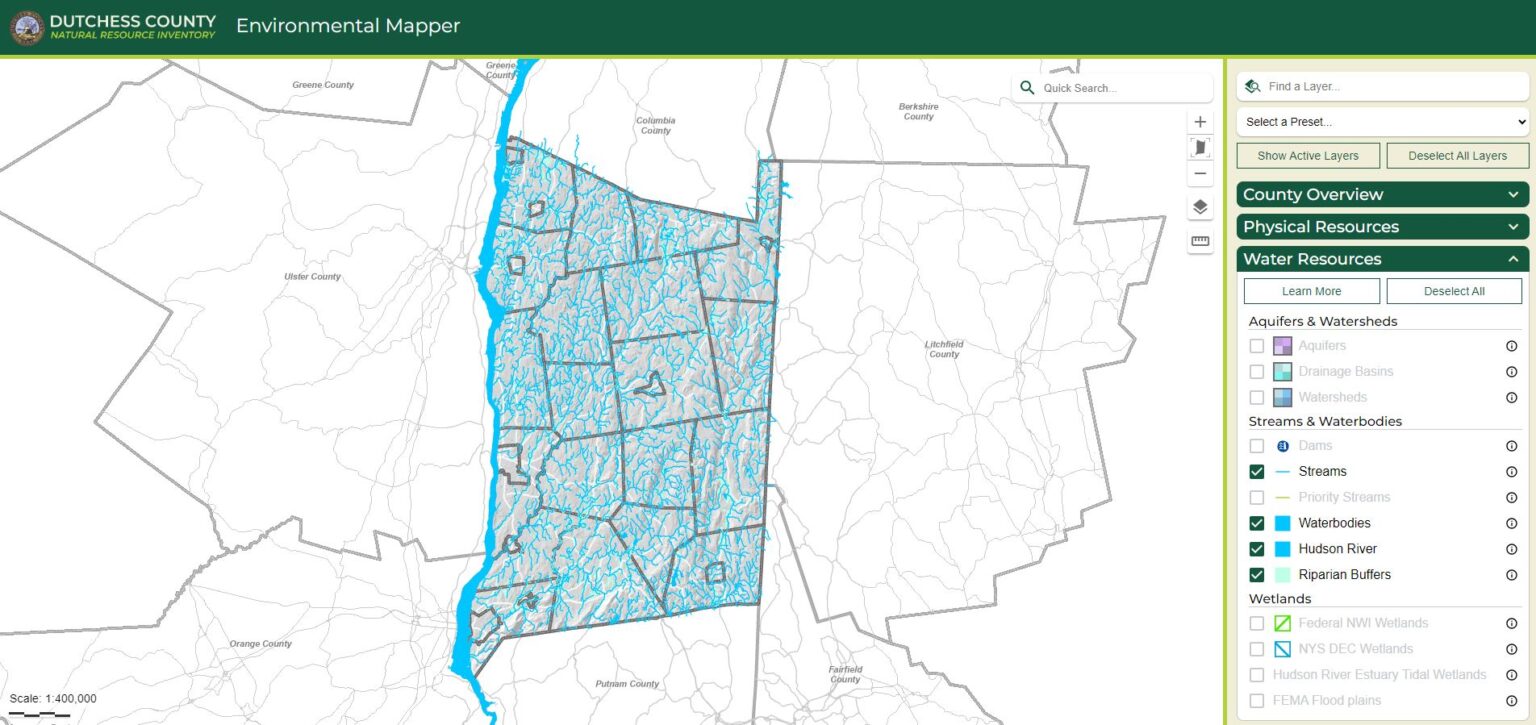
Aquifers most capable of supporting high-yielding wells generally consist of sand and gravel. These deposits lie along some of the county’s major stream and river valleys, a result of glaciers leaving behind deposits after the latest glacial period. In some places, these glacial outwash deposits overlie limestone or marble (carbonates) bedrock formations. Some bedrock formations in Dutchess County consist of carbonates (limestone, marble, or dolomite); these formations tend to be more fractured than other bedrock formations, so they can support high-capacity wells capable of withdrawing hundreds of gallons per minute. The Dutchess Environmental Mapper aquifer layer shows areas in Dutchess County where carbonate bedrock aquifers are covered by glacial outwash sediments which include sand and gravel areas. These areas offer some of the most promising lands for installing high-yield test wells, found in the Harlem Valley along the Tenmile and Swamp Rivers, along the Wappinger Creek, and along the Fishkill Creek. Extensive sand and gravel deposits not necessarily overlying limestone formation also exist along the Sprout Creek in East Fishkill and LaGrange, the east branch of the Wappinger Creek in Washington, and the Saw Kill Creek in Red Hook. See the Physical Resources Section for more information about surficial and bedrock geology.
Well yields will tend to be highest in areas where the sediment or fractured rock geologic formations have high hydraulic conductivity tendencies and where these areas lie low in their respective watersheds so groundwater flows toward them from large up-watershed area. The water-bearing characteristics of unconsolidated deposits vary widely because of differences in porosity and hydraulic conductivity (also often referred to as permeability). Hydraulic conductivity is a measure of the ability of a material to transmit water. In unconsolidated deposits, permeability depends on the size of the pores between the particles of sand, gravel, silt, or clay. In bedrock, permeability depends on the degree of fracturing and how well the rock fractures, crevices, and cavities interconnect. The higher the permeability of a material, the greater the potential immediate yield, again, providing there is adequate recharge to replenish the withdrawal. Porosity influences the volume of water that will be present below the water table in a particular geologic formation. Where there is more porosity, more water can be present in transit within the aquifer as groundwater is moving toward streams and wetlands.
Sand and gravel are especially valuable aquifer materials because they are highly porous and permeable. The pores in sand and gravel deposits are large enough to hold considerable volumes of water, while allowing water to flow easily toward wells, springs, and other discharge points. Known yields from sand and gravel aquifers in Dutchess County range from 2 to 1,400 gallons per minute (gpm). Clay, on the other hand, is extremely impermeable, so few wells other than some early hand-dug wells are completed in clay deposits. Detailed analysis of wells installed in Putnam County indicates that in general, wells are being drilled deeper each decade as drilling techniques become less costly and as higher levels of yield reliability are required by regulators. There is no evidence that aquifers are being depleted or becoming plugged.
As described in this inventory’s Geology section, much of Dutchess County’s bedrock is composed of shales and slates. These all have low porosity and low permeability. The bedding planes and fractures in these rocks allow slow movement of groundwater. Studies by the United States Geological Survey show that yields from drilled wells in these average 16 gpm, with hilltop wells yielding 14 gpm and valley wells yielding 17 gpm.
The more mountainous parts of Dutchess County are underlain by crystalline types of bedrock such as Hudson Highlands Gneiss and Poughquag Quartzite, where there are fewer openings for water infiltration. Well yields are relatively low, averaging 11 gpm for the gneiss and 10 gpm for the quartzite. Unproductive wells have been drilled in all these formations, the result of drilling that has the misfortune to miss any water-bearing fractures. The natural quality of groundwater withdrawn from Dutchess County’s geologic formations reflects the mineral composition of each formation as a result of the contact time between the natural water with the geologic materials.
Dutchess County’s aquifer monitoring program and the simple overall water budget calculation indicate that no broad reductions in aquifer water capacity or water table levels are occurring. However, stream flow analyses conducted by the former Dutchess County Environmental Management Council, The Chazen Companies, and Horsley Witten have nonetheless identified some areas where stream flows have been or can be modified by groundwater withdrawals. Such stream flow reductions are likely related to groundwater withdrawals without adequate off-setting return flows. Specific examples of likely direct influences of water use on stream flows include:
- Heavy pumping of wells used by the Millerton community can affect the flow of the nearby Webatuck Creek. F
- Flow of the Sprout Creek may be reduced as it flows through the Town of Wappinger as a result of well withdrawals.
- A segment of the Wappinger Creek north of the hamlet of Pleasant Valley has been documented to lose flow (less water in the stream) due to unexplored factors.
- Under low flow conditions, daily flow fluctuations symptomatic of well withdrawals are documented by flow variations recorded by the USGS stream gauging site at Red Oaks Mill on the Wappinger Creek.
Groundwater Quality
Groundwater quality can be impacted by a wide range of contaminant sources. Most contaminant point sources are well known and carefully managed (such as industrial contaminant spills, gas stations, dry cleaners, and injection wells). Others are diffuse and widespread (such as road salt, fertilizers and pesticides, and septic systems). Some are “emerging,” meaning that insufficient research has been completed to know either the prevalence of the impact or the significance of the impact to human or ecosystem health (such as pharmaceutical and personal care chemical releases from wastewater plants, septic systems, and stormwater recharge features).
The following outlines the water quality data from a study that collected 250 water samples from active domestic wells in Dutchess County from 2008 to 2009 [2]. Only well samples minimally impacted by nitrate, sodium, and chloride were included in this analysis, as these conditions best reflect what would be expected in areas of low-impact land uses.
In areas with limestone, dolostone or marble bedrock (primarily in the valleys of the Fishkill Creek watershed, Tenmile/Webutuck/Swamp watershed, and the Wappinger Creek watershed), groundwater is moderately alkaline and hard. Iron may exceed the standard of 0.3 mg/L in more than 25 percent of samples. All sampled parameters are reasonable, low, and pH is slightly basic.
In areas with crystalline bedrock (primarily in southern portions of East Fishkill and Union Vale, and western portions of Pawling), groundwater is generally soft. Approximately 10 percent of samples may contain lead in concentrations exceeding the drinking water standard of 0.02 mg/L, approximately 25 percent of samples contain sodium in concentrations exceeding the lowest guidance value of 20 mg/L, and sulfate values are lower than levels identified in the limestone and shale terrains. All other sampled parameters are reasonable, low, and pH is neutral.
In areas where wells are installed in shale, slate, and schist (most hillsides and uplands of Dutchess County, except crystalline uplands identified previously), groundwater is moderately hard. Iron and manganese may exceed the drinking water standard in approximately 10 percent of water samples, and chloride concentrations exceed the drinking water standard in more than 10 percent of samples. All other sampled parameters are reasonable, low, and pH is slightly basic.
In general, point sources of pollution are adequately managed and spills, although unfortunate, are managed in prescribed ways. Contaminant plumes occur and their locations are generally known, and remediation efforts are usually underway. Legal mechanisms require reporting and correction for new spills.
Drinking Water
The 2020 census indicates that 60 percent of the county’s total population of 295,911 is served by community surface or groundwater systems; the remaining 40 percent relies on private domestic wells.
The Hudson River is by far the county’s largest supplier of drinking water, providing more than 11.7 million gallons per day (mgd) to approximately 70,000 residents in the city and town of Poughkeepsie, Hyde Park, Hopewell Junction (Maybrook water line), and the Village of Rhinebeck. New York City has also established a Hudson River tap and pumping station at Chelsea, in the Town of Wappinger as a precaution against water shortages in its upstate system.
The salt front of the Hudson River (defined as concentrations of chloride greater than 100 mg/L) shifts regularly and predictably along the southwestern border of the county. It moves with the balance between the downstream inflow of freshwater and the upstream forces of the ocean tides. Under average flow conditions, the salt front is typically well south of Beacon. However, in drought years the salt front can move close to the Poughkeepsie water intake, particularly at low tide. Water containing about 100 mg/L of chloride requires notification to those using it for drinking water, and under those conditions, precautions need to be taken to limit the amount of Hudson River water consumed by individuals on sodium-restricted diets.
In addition to the Hudson, many public well fields tap aquifers adjacent to the county’s major interior waterways, providing 10.4 mgd to county residents. At present, no public water supplies are drawn directly from these larger streams and rivers, but the close proximity between the wells and streams does provide for interaction. Several smaller streams or reservoirs, however, do provide water for community systems in Beacon, Hyde Park, and the Village of Pawling as well as for large institutions in Dover, Beekman, and Red Hook.
Watersheds
Drainage Basins
Water drains from the land surface through drainage features ranging from rivulets in shopping center parking lots to large rivers like the Hudson. The entire area drained by a particular creek, stream, or river is called a drainage basin or watershed. The ridge that nearly encircles a drainage basin and separates one basin from another is called the basin or watershed boundary. These boundaries are based on surface topography, and it is easy to imagine how a drop of rainwater falling on one side or the other of a drainage boundary runs downhill to feed the streams of the respective basins. Subsurface flow (below the ground surface) generally follows the surface topography but large aquifers can extend across drainage basins and water may even move in directions different from surface flow (see Groundwater Resources section below). Surface basins are nested, with smaller streams contributing flow to the network. For example, each small tributary of the Little Wappinger Creek has its own drainage basin and is included in the 33.4 square mile watershed of the Little Wappinger Creek. This watershed is considered part of the 210 square mile Wappinger Creek basin which, in turn, is included in the lower Hudson subdivision of the Hudson River watershed. Major watersheds of Dutchess County are shown in the Dutchess Environmental Mapper.
All of the surface water within a given watershed is part of the same hydrologic system. Watersheds, therefore, are the most appropriate geographic area for the study of surface water resources, the development of water resource management strategies, and the development of comprehensive waste treatment plans. Because all land uses both depend on and influence the quality and quantity of water supplies, watersheds are also the most logical physical units for natural resource management and land use planning.
List of Major Drainage Basins in Dutchess County by size, including drainage areas, and flow attributes.| Basin | Area (sq mi.) | 10th-90th Percentile Flow (cfs) |
| Fishkill at Beacon | 190 | 25-680 |
| Wappinger near Wappinger Falls | 181 | 21-600 |
| Casperkill | 11 | NA |
| Fallkill | 19 | NA |
| CrumElbow at Hyde Park | 19 | 1.9-60 |
| Landsman Kill | 11 | NA |
| Saw Kill at Red Hook | 21 | 4.6-68 |
| Stony Creek | 22 | NA |
| Ten Mile at Wassaic | 120 | 14.5-430 |
Most of the land in Dutchess County is within the Hudson River drainage basin, while a portion of the Harlem Valley drains into the Housatonic River in Connecticut (Map 5.1). Approximately 67 percent of the county’s 807 square miles drain to the Hudson River through the Wappinger Creek, Fishkill Creek, and several smaller streams including the Casperkill, Fall Kill, Crum Elbow, Landsmankill, Saw Kill, and Stony Creek. The Tenmile River basin, part of the Housatonic River basin that ultimately drains to Long Island Sound, covers nearly 210 square miles or 26 percent of the county, including all of Dover and Amenia and most of North East and Pawling. The remaining 7 percent of the county is divided between two other watersheds: a small area in the southeastern corner drains into the Hudson River via the Croton River and a small portion in the North that drains to the Hudson via the Roeliff Jansen Kill.
Hudson River Basin
The Hudson River receives most of the surface runoff from Dutchess County streams and is also the water supply for the City of Poughkeepsie, surrounding areas, such as parts of Hyde Park, and some major industries such as IBM. The Hudson River is tidal, with about a 3-foot tidal range, therefore, currents reverse four times each day. Nutrient and suspended sediment concentrations are moderately high [3], and the primary drinking water issue is the occasional intrusion of salt water from downriver. Sea-level rise will eventually cause increases in upriver salt intrusions but the timing and magnitude are presently unknown.
The major water sources to the section of the Hudson along the Dutchess County shoreline are from the upper Hudson and the Mohawk River. Suspended sediments, contaminants, and wastewaters from upriver are delivered to the Dutchess County portion of the Hudson River but in general concentrations are not high enough to impede use as a drinking water supply.
Wappinger Creek Basin
The Wappinger Creek and its tributaries drain approximately 210 square miles, roughly one-fourth of Dutchess County. The drainage area extends about 30 miles southwest from the Town of Pine Plains toward New Hamburg at the southern tip of the Town of Poughkeepsie. There are three major branches of the Wappinger Creek: the Little Wappinger, the Main Branch, and the East Branch, and these converge near Salt Point in the town of Pleasant Valley. The Wappinger drainage basin includes large parts of the Towns of Pleasant Valley, Washington, Pine Plains, Milan, Stanford, and Clinton; the Villages of Millbrook and Wappingers Falls; and portions of the Towns of Wappinger, Poughkeepsie, LaGrange, and Fishkill. The Wappinger Creek basin is primarily forested, with some agriculture in the upper watershed and increasing residential, urban, and industrial areas moving downstream.
Fishkill Creek Basin
The Fishkill Creek basin covers approximately 194 square miles. Fishkill Creek, the basin's primary stream, begins in the center of the county in Union Vale and flows southwest, entering the Hudson River at Beacon. It drains large parts of Union Vale, Beekman, East Fishkill, and Fishkill, and a smaller portion of Wappinger. (The basin also includes the Towns of Philipstown and Kent in Putnam County.) Sprout Creek, Fishkill Creek's primary tributary, drains major sections of LaGrange and Union Vale and small portions of Wappinger and East Fishkill. Like the adjacent Wappinger Creek basin, the landcover/use in the Fishkill basin grades from forest, agriculture and low-density residential in the upper basin to higher-density and urban nearer Beacon.
Tenmile River Basin
The Tenmile River drains 210 square miles in the eastern section of Dutchess County, from the Columbia County line south to the town of Pawling. The basin ranges from 5 to 8 miles wide, is 33 miles long, and has four principal watercourses: the Tenmile River itself, Swamp River, Webatuck Creek, and Wassaic Creek. The Tenmile River falls an average of 16 feet per mile as it travels its narrow path southward from the town of North East, through the Harlem Valley lowlands in Amenia and Dover, and enters Connecticut near Dogtail Corners. The Swamp River flows north from Pawling and joins the Tenmile River south of Dover Plains. The Tenmile River and its tributaries wind through extensive floodplains and wetlands. During periods of increased runoff these areas retain flood waters, helping to minimize downstream flooding. Because the Tenmile River basin is not as developed as other drainage basins in the county, there are still many opportunities to preserve the functional and wildlife values of these wetlands and floodplains while accommodating agricultural activity and growth.
Streams & Waterbodies
Surface Water Quantity
Eight-hundred miles of streams flow across the Dutchess County landscape. When managed properly, this high density of surface water provides residents with adequate water supplies and provides enough water to sustain our natural systems. In addition to the streams, there are 93 named lakes and ponds in Dutchess County and dozens that are unnamed. Many of the lakes and ponds, such as the largest Whaley Lake, were artificially created.Table 1: Lakes and ponds in Dutchess County larger than 25 acres
| Name | Location | Approx. size in acres |
| Abels’ Lake | Union Vale | 59 |
| Black Pond | East Fishkill | 176 |
| Bontecou Lake | Washington | 115 |
| Lake Carvel | Pine Plains | 38 |
| Cobalt Lake | Poughkeepsie | 29 |
| Crane Pond | Dover | 38 |
| DeFlora Bros. Lake | Hyde Park | 43 |
| Dieterich Pond | Millbrook | 32 |
| Lake Dutchess | Pawling | 51 |
| Ellis Pond | Dover | 61 |
| Green Mountain Lake | Pawling | 35 |
| Halcyon Lake | Pine Plains | 26 |
| Hillside Lake | East Fishkill | 26 |
| Hunns Lake | Stanford | 68 |
| Indian Lake | North East | 194 |
| Little Whaley Lake | Pawling | 52 |
| Long Pond | Clinton | 66 |
| Nuclear Lake | Pawling | 55 |
| Quaker Lake | Pawling | 64 |
| Round Pond | Amenia | 49 |
| Round Pond | Milan | 40 |
| Rudd Pond | North East | 76 |
| Sepasco Lake | Rhinebeck | 26 |
| Sharpe Reservation Pond | Fishkill | 26 |
| Shaw Pond | Washington | 26 |
| Silver Lake | Clinton | 115 |
| Spring Lake | Milan | 26 |
| Stissing Lake | Pine Plains | 78 |
| Swift Pond | Amenia | 61 |
| Sylvan Lake | Beekman | 116 |
| Thompson Pond | Pine Plains | 68 |
| Twin Island Lake | Pine Plains | 62 |
| Tyrrel Lake | Pleasant Valley | 45 |
| Upton Lake | Stanford | 43 |
| Lake Walton | East Fishkill | 42 |
| Wappingers Lake | Wappingers Falls | 112 |
| Lake Weil | Dover | 34 |
| Whaley Lake | Pawling | 287 |
Surface Flow
Surface water in Dutchess County reflects the integrated effects of all watershed characteristics that influence the hydrologic cycle. Characteristics include climate of the drainage basin (type and distribution patterns of precipitation and temperature regime), geology, land use/cover (permeable or impermeable surfaces and materials and human-built drainage systems), and vegetation (uptake of water by plants, protection against erosion, and influence on infiltration rates). Combined, these factors determine the amount of water flowing through the streams at any given moment. For example, an urbanized watershed with impervious surfaces will have higher peak discharges following storms than a watershed that is predominantly forested and allows a higher percentage of rain water to slowly infiltrate before it reaches the stream. These stream flow patterns directly affect aquatic habitat, flood behavior, recreational use, and water supply and quality.
The literature has documented the deleterious effects impervious surfaces have on biota [4], stream stability [5], and in-stream water quality [6]. For example, impervious surfaces can raise the temperature of stormwater runoff, which in turn reduces the water’s ability to hold dissolved oxygen and harms some game fish populations, while promoting excess algal growth. Field observation, research, and hydrologic modeling suggest a threshold of 10 percent impervious surface in a watershed, after which there is marked transition to degraded stream conditions [7].
Between the 1960s and 1990s, the U.S. Geological Survey (USGS) participated in various studies at 84 stream sites in Dutchess County. Today, the USGS operates only three gage stations in Dutchess County: one on the Tenmile River near the Connecticut line, another on the Wappinger Creek near Wappingers Falls, and a third on the Hudson River near Poughkeepsie. The scarcity of up-to-date information about surface water flow rates makes it difficult to assess the hydrological impacts of recent land use changes on the county's watersheds.
Floodplains
Floodplains are low-lying areas, normally adjacent to streams, which are inundated in times of heavy rains or severe snow melts. They act as shock absorbers in a drainage system by providing space for the storage and absorption of excess runoff. Left undisturbed, floodplains can also serve as recharge areas for groundwater supplies due to the heterogeneous texture of their alluvial soils.
Floodplains that have a one percent annual chance of being inundated are commonly referred to as 100-year floodplains. In a similar manner, land areas that have a 0.2 percent annual chance of being flooded are 500-year floodplains. Another way of stating this concept is that floods of these magnitudes would have a return interval averaging 100 years and 500 years respectively. Such floodplains line the rivers and streams of Dutchess County. Detailed maps of the 100-year floodplains in all of the municipalities of Dutchess County have been developed by the Federal Emergency Management Agency (FEMA) in support of the National Flood Insurance Program. These maps are used to determine low-cost federal flood insurance rates and to develop local land use controls that comply with FEMA's requirements.
In reviewing floodplain maps, it is important to note that the locations of floodplain boundaries are not static. Floodplain boundaries are altered as a result of changes in land use, the amount of impervious surface, placement of obstructing structures in floodways, changes in precipitation and runoff patterns, improvements in technology for measuring topographic features, and utilization of different hydrologic modeling techniques.
100-year floodplain acreages for Dutchess County municipalities| Municipality | 100-year floodplain acreage | Percentage of municipality |
| CITIES | ||
| Beacon | 251 | 8 |
| Poughkeepsie | 188 | 5 |
| TOWNS | ||
| Amenia | 1,429 | 5 |
| Beekman | 699 | 4 |
| Clinton | 1,184 | 5 |
| Dover | 2,379 | 7 |
| East Fishkill | 5,280 | 14 |
| Fishkill | 1,756 | 9 |
| Hyde Park | 1,232 | 5 |
| LaGrange | 3,687 | 14 |
| Milan | 345 | 1 |
| North East | 1,207 | 4 |
| Pawling | 2,122 | 8 |
| Pine Plains | 955 | 5 |
| Pleasant Valley | 2,057 | 10 |
| Poughkeepsie | 2,038 | 10 |
| Red Hook | 1,051 | 4 |
| Rhinebeck | 760 | 3 |
| Stanford | 1,095 | 3 |
| Union Vale | 745 | 3 |
| Wappinger | 2,313 | 13 |
| Washington | 661 | 2 |
| VILLAGES | ||
| Fishkill | 144 | 27 |
| Millbrook | 93 | 8 |
| Millerton | 25 | 6 |
| Pawling | 190 | 17 |
| Red Hook | Not Available | Not Available |
| Rhinebeck | 70 | 7 |
| Tivoli | 44 | 4 |
| Wappingers Falls | 125 | 16 |
| COUNTY TOTAL | 34,125 | 6 |
Flood-prone areas are currently referred to by FEMA as Special Flood Hazard Areas that encompass by definition lands that occur within the 100-year floodplain. The table above indicates that 6 percent (34,125 acres) of Dutchess County is flood-prone. The floodplain acreages listed in the table range from a low of 1 percent in the Town of Milan to a high of approximately 27 percent in the Village of Fishkill.
As previously discussed, a floodplain's ability to carry flood flows safely depends both on the types of development within the floodplain and on the land use characteristics of the surrounding watershed. The amount of runoff within a watershed increases with the amount of developed area because development generally brings an increase in the percentage of impervious surface area. Precipitation on or snowmelt from these impervious surfaces is rapidly directed into nearby channels, thereby increasing the volume of water the channel is expected to carry. All of the runoff from a given watershed eventually funnels through a series of channels to the major stream or river at the watershed mouth. The floodplains along these channels become inundated more frequently and with greater volumes of water as upstream development intensifies.
As described in the Climate Chapter, several significant floods have occurred in Dutchess County. Flooding frequently occurs in the early spring when melting snow cannot be absorbed by the still-frozen or saturated ground. Serious floods also occur as a result of hurricanes or coastal storms such as those that occurred in 1938, 1955, 2007, 2011 and 2012.
Floodplain soils in the county consist of sand and silt mixtures with some gravel. The floodplains are usually fertile and flat and are often deceptively attractive development sites. The floodplains most susceptible to serious flood damage are along the lower Wappinger and Fishkill Creeks where development has already occurred. In the Harlem Valley, extensive flooding has occurred along the Webatuck Creek, the Swamp River, and the Tenmile River.
Wetlands
Wetlands are found where the water table is at or near the surface of the land for a significant portion of the year. Plant communities are dominated by species either tolerant of or actually requiring wet soils. In NYS, the legal demarcation of wetlands is based on vegetation but other states may use soil indicators or evidence of prior flooding. Different kinds of wetlands can exist depending upon location, topography, geology, and hydrology.
Freshwater wetlands cover 6.4 percent of Dutchess County, or approximately 33,000 acres. Many of the wetlands in the county are small and scattered about the county without any discernible pattern. There are concentrations, however, along many of the major waterways, including the Swamp River in the Towns of Pawling and Dover, the Tenmile River in Amenia and North East, and the Fishkill Creek in East Fishkill. The Great Swamp, which extends along the Tenmile and Swamp Rivers from Dover well into Putnam County, is one of the largest and most diverse wetlands in the state. Several large tidal wetlands border the Hudson River.
Historically, wetlands have been regarded as wastelands, useful only if they could be filled or drained for development or agricultural purposes. Because of this attitude, at least half of the wetlands in the lower 48 United States have been destroyed since colonial time [8]. Wetlands are now recognized for the many benefits they provide, including storage of floodwaters, removal of many pollutants, and breeding areas for amphibians and many other animals and plants.
Wetlands are unique resources at the interface between water and land. Hydrogeologic studies have shown that wetlands are often important regulators and purifiers of surface water and groundwater supplies. Flooded wetlands can, in turn, recharge groundwater supplies or surface waters. Water stored in wetlands helps maintain continuous stream flows during droughts.
Water Quality
Surface Water Quality
Several parameters are used to assess water quality and track human-induced impacts. Many of the data reported here are medians for selected water quality variables. The source of the majority of the data below is a study by the Dutchess County Environmental Management Council [9]. Similar information, although spanning a different time period, is available for the Tenmile River at Wassaic and there have been many studies at specific sites conducted by the Hudson River National Estuarine Research Reserve, The Cary Institute of Ecosystem Studies, and faculty at Vassar College.
Chloride
Chloride is the negatively charged portion of a variety of salts including sodium chloride (NaCl), calcium chloride (CaCl2 ), and magnesium chloride (MgCl2 ). Chloride enters surface water from several sources including geologic formations containing chloride, agricultural runoff, industrial wastewater, effluent from wastewater treatment plants, and a major contribution from salting of roads. Excess chloride can contaminate freshwater streams and lakes, negatively affecting aquatic communities.
While there are no set standards for chloride in fresh surface waters, studies have shown impacts on aquatic communities at various concentrations. Chloride concentrations of approximately 120 mg/L should be protective of freshwater organisms for short-term exposure; concentrations less than 35 mg/L are likely protective during long-term exposures [10]. Approximately 5 percent of species would experience effects from chronic exposure to concentrations of chloride of 210 mg/L, while 10 percent of species would be affected at concentrations of 240 mg/L [10]. According to the United States Environmental Protection Agency, biota on average should not be affected if the four-day average concentration of chloride does not exceed 230 mg/L more than once every three years [11].
Biotic impacts would be minimal if the one-hour average chloride concentration did not exceed 860 mg/L more than once every three years [3]. In a 2006 study of Dutchess County tributaries to the Hudson River [9], chloride concentrations were below levels set by the EPA for acute (860 mg/L) and chronic (230) exposure [12], but it is worth noting that Environment Canada recommends maintaining chronic chloride concentrations at or below 35 mg/L [10]. The annual median chloride concentration for Dutchess County streams ranged from less than 2 to 127 mg/L (Table 1). It is difficult to evaluate this chronic threshold because the data collected during this study were not collected frequently enough to develop chronic exposure recommendations. It is notable, however, that all the watershed median concentrations were higher than Environment Canada’s chronic threshold except the highly forested watersheds of Mount Beacon which fell well below 35 mg/L.
The highest median annual chloride concentrations were in the suburbanized watersheds of the Casperkill, and two streams designated HR 99 and HR 98. Although one would expect that the highest median concentrations would be in urban streams like the Fall Kill in Poughkeepsie and the Fishkill in Beacon, their annual median chloride concentrations were not nearly as high as in these suburban watersheds. The Fall Kill shows effects of road salting with extremely high chloride concentrations in January and much lower concentrations in the summer months. However, the Casperkill, HR 99, HR 98, and the Fishkill Creek contained high chloride concentrations throughout 2004. On average for all the watersheds, summer/fall chloride concentrations were higher than winter/spring concentrations. This could be an indication of a chronic source of chloride such as sewage, or perhaps road salt is being stored in the sediment and released throughout the year following rain events [13].
Phosphorus
Phosphorus is a nutrient essential to plant growth. In aquatic ecosystems phosphorus occurs primarily in the form of organic phosphorus, which is bound in plant and animal tissue and unavailable for plant uptake. Plants are able to assimilate phosphorus in the form of phosphate (PO4 3-) from the surrounding water and convert it to organic phosphorus. In freshwater ecosystems phosphate tends to be the least available nutrient, causing it to be the limiting factor for plant growth. Because of this, small additions of phosphate to surface waters can result in large amounts of plant growth and eutrophication.
The most likely sources of phosphate inputs include animal wastes, human wastes, fertilizer, detergents, disturbed land, road salts (anticaking agent), and stormwater runoff. In general, any concentration over 0.05 mg/L of phosphate will likely have an impact on surface waters [14]. However, in many waterbodies, concentrations of phosphate as low as 0.01 mg/L can have a significant impact. In order to control eutrophication, the USEPA recommended limiting phosphate concentrations to 0.05 mg/L in waters that drain to lakes, ponds and reservoirs, and 0.1 mg/L in free flowing rivers and streams [15]. New York has an existing ambient water quality guidance value of .02 mg/l for phosphorous [16].
The median phosphate concentration of Dutchess County’s streams ranged from 0.01 mg/L in several streams to 0.09 mg/L in the Sawkill (Table 5.3).
In-stream median annual phosphate concentrations were similar to the threshold value in the literature of 0.010 mg/L for relatively undeveloped watersheds in the United States. Indian Kill, Crum Elbow Creek, Maritje Kill, Wappinger Creek, HR 98, and Wade’s Brook all fell within this threshold. The three watersheds that stood out with high phosphate concentrations were Stony Creek, Saw Kill, and HR 99. In Stony Creek and the Saw Kill, concentrations were highest in July during the lowest flow period. This is an indication of a chronic source of phosphate that becomes more evident as water levels drop and the phosphate becomes more concentrated. The source may have been the wastewater treatment plants that were upstream of the sampling sites. However, HR 99 contained consistently high phosphate concentrations throughout the year. This could suggest another source such as failed septic systems or fertilizers, or be an indication that the stream is just too small to effectively dilute the wastewater effluents it receives.
Nitrogen
Nitrogen is found in various forms in ecosystems including organic forms such as proteins and amino acids, nitrate (NO3 - ), nitrite (NO2 - ), and ammonium (NH4 + ). The majority of nitrogen on earth is in its gas form (N2 ), which makes up approximately 80 percent of our atmosphere. It is converted into organic forms by certain terrestrial plants (legumes), nitrogen-fixing bacteria, lightning, and microbes in the water and soil. Nitrate, the most mobile form of nitrogen, can be assimilated by vegetation to make protein, leached into groundwater or surface water, or converted to nitrogen gas in the process of denitrification [17]. Nitrite, ammonia, and ammonium are intermediate forms of nitrogen in aquatic systems and are quickly removed from the system by being converted to either nitrate or nitrogen gas [14]. Ammonium is released into the system during decomposition or when animals excrete their wastes; through the process of nitrification, ammonium is oxidized to nitrate by bacteria.
Major sources of nitrate in streams include municipal and industrial wastewater discharges and agricultural and urban runoff. Atmospheric deposition of nitrogen from automobile exhaust, power plants, and industrial emissions is also a source [18].
Excess nitrate can accelerate the eutrophication of surface waters and can present a human health concern in drinking water. Nitrate concentrations of 44 mg/L (equivalent to 10 mg/L nitrate-nitrogen for EPA and NYSDOH standards) or higher have the potential to cause methemoglobinemia, or “blue baby” disease in children [19]. High concentrations of nitrate in water can serve as an indicator of sewage, fertilizers, or other contaminants. Although the human health standard for nitrate consumption has little correlation with stream health, high levels of nitrate in both surface and groundwater typically indicate widespread nonpoint source pollution.
Due to land uses and atmospheric deposition, concentrations of in-stream nitrate typical of undeveloped watersheds rarely occur in the Hudson Valley. The annual median nitrate concentration of Dutchess County’s streams ranged from 0.02 (HR90) to 6.75 mg/L (Saw Kill) (Table 1). With the exception of Wades Brook and HR-90, median nitrate concentrations in Dutchess County streams were all above the threshold value of 0.087 mg/L for streams in the United States in relatively undeveloped watersheds [20]. Gordon’s Brook, Wade’s Brook, and HR 90 all contained relatively low concentrations of nitrate, chloride, and phosphate because their watersheds mostly drain the heavily forested Mount Beacon. These watersheds could be considered as a reference baseline for comparison with other local watersheds.
In northern Dutchess County, nitrate concentrations were highest in Stony Creek and the Saw Kill in July 2004. These high concentrations occurred during periods of low flow, indicating a chronic source of nitrate that becomes diluted during higher flows. The source could be treated sewage effluent since both sampling sites were downstream of wastewater treatment plants, and/or septic system effluent. Watersheds in the Poughkeepsie-Fishkill region had the highest median annual nitrate concentrations, and the highest individual reading was in the Fishkill Creek in July 2004. The Fall Kill, located in one of the most urbanized areas of Dutchess County (City of Poughkeepsie), contained relatively low nitrate concentrations, likely because a majority of the watershed above the sampling site was sewered and several ponds and wetlands located upstream of the sewered section trap pollutants.
Conductivity
Conductivity measures the ability of water to carry an electric current and is determined by bedrock geology and the addition of salts from several human activities. Studies of inland freshwaters indicated that streams supporting good mixed fisheries had a conductivity range of 150 to 500 µmhos/cm [21] , and that a benchmark of 300 µmhos/cm is appropriate for invertebrate genera [22] Annual median conductivity for Dutchess County streams ranged from near 50 µmhos/cm (at HR90 and Wade’s Brook) to nearly 1000 µmhos/cm (at HR 99, Table 1).
Table 1: Annual median nitrate, phosphate, chloride and conductivity summary for 2004 (collected January through November, bimonthly) and the water quality impact criteria from literature values (expanded upon in introduction).
| Watershed | Nitrate (mg/L) | Phosphate (mg/L) | Chloride (mg/L) | Conductivity (µmhos/cm) |
| Stony Creek | 3.08 | 0.05 | 34.85 | 396.5 |
| Saw Kill | 6.75 | 0.09 | 38.84 | 357.5 |
| Muddler Kill | 1.09 | 0.02 | 76.55 | 476 |
| Landsman Kill | 3.95 | 0.06 | 42.99 | 376.5 |
| Fallsburg Creek | 1.16 | 0.02 | 47.4 | 352 |
| Indian Kill | 1.64 | 0.01 | 44.56 | 434 |
| Crum Elbow Creek | 2.42 | 0.01 | 40.14 | 246 |
| Maritje Kill | 3.19 | 0.01 | 62.26 | 531 |
| Fall Kill | 1.21 | 0.02 | 76.89 | 501.5 |
| Casper Kill | 5.19 | 0.03 | 127.34 | 740.5 |
| Wappinger Creek | 2.25 | 0.01 | 46.59 | 393 |
| HR99 | 4.96 | 0.32 | 126.34 | 977.5 |
| HR 98 | 2.36 | 0.012 | 119.25 | 689 |
| Fishkill Creek | 8.87 | 0.04 | 78.3 | 611.5 |
| Gordons Brook | 0.17 | 0.02 | 4.51 | 69.15 |
| Wades Brook | 0.06 | 0.01 | 1.57 | 51 |
| HR 90 | 0.02 | 0.02 | 1.59 | 55.8 |
| Literature Concentrations for Non-impacted Streams | 0.087 (Clark et al., 2000) | 0.010 (Clark et al., 2000) | 230 (4-day average) (USEPA, 2005a) | 500 (USEPA, 1997) |
Other Chemical and Physical Parameters
Dissolved oxygen refers to oxygen gas (O2 ) molecules in the water. The molecules are naturally consumed and produced in aquatic systems and are necessary for almost all aquatic organisms. If dissolved oxygen levels fall below a certain threshold, biologic integrity will be compromised. For example, on a scale of 0 to 14 mg/L, a concentration of 7 mg/L to 11 mg/L is ideal for most stream fish (Behar, 1997). Dissolved oxygen can be measured as the concentration of milligrams O2 per liter (mg/L) or as percent saturation of O2 . Percent saturation is the amount of oxygen in a liter of water relative to the total amount of oxygen the water can hold at a given temperature. In cold water systems, a percent saturation of 60 percent to 79 percent is acceptable for most stream animals [14]. The lowest values in a stream will typically occur near dawn under low flow, warm conditions. High frequency sampling required to detect sporadic low oxygen conditions have not been conducted for many sites across the county, but spot sampling showed a July 2004 median of 7.2 mg/L in 16 Hudson River tributaries, with the lowest value of 1.3 mg/L in Fallsburg Creek in Rhinebeck.The pH of water is important to monitor because most species of aquatic organisms require a pH in the range of 6.5 to 8.0; variance outside of this range can stress or kill organisms. Due to the acidity of rainfall in the northeastern United States, maintaining this range is of concern. Average pH of rainfall in New York ranges from 4.0 to 4.5. Dutchess County contains large amounts of calcium carbonate bedrock, which provides a buffer for acidic inputs and acts to raise the alkalinity and hardness of water. However, this buffering capacity can diminish over time with geologic weathering.
Sulfate (SO4 2-) can occur naturally as a result of decomposition of organic matter, water passing through rock or soil containing gypsum and other common minerals, or atmospheric deposition. It can be also be found in municipal sewer treatment plant discharges, fertilized agricultural runoff, or industrial discharges. The combustion of fossil fuels releases large amounts of sulfur to the atmosphere, where it is oxidized to sulfate and may fall in precipitation or be deposited as gas. Sulfate is highly mobile and often ends up in streams and lakes; therefore, monitoring levels of sulfate in surface waters may provide a means of tracking impacts of fossil fuel combustion. The median concentration of sulfate across all streams in the 2006 Hudson River tributaries study was 17.3 mg/L; the highest concentration was found in the lower Fishkill at 52.2 mg/L. Several streams with long-term water quality monitoring have shown declines in SO4 concentrations almost certainly due to lowered sulfur emissions following the Clean Air Act Amendments.
Turbidity is an optical measurement of the light-scattering at 90o caused by particles suspended in water. Turbidity is measured in arbitrary “nephelometric turbidity units” (NTUs) by a “nephelometer.” The higher the NTU value, the lower the water clarity and the murkier the appearance. Total suspended solids are a measure of suspended solids concentration, expressed as a mass per volume (mg/L) obtained by physically separating the liquid and solid phases by filtration. There is no single, fixed relationship between turbidity and total suspended solids. Turbidity can be influenced not only by the amount of particles in suspension but also by the shape and size of the particles. Increased turbidity can be caused by soil erosion, waste discharge, urban runoff, bottom feeders such as carp, and algal growth. Turbid waters become warmer as suspended particles absorb heat from sunlight, causing oxygen levels to fall. Photosynthesis also decreases with less light, resulting in even lower oxygen levels. Finally, the suspended material in turbid water can clog fish gills, reduce growth rates, decrease resistance to disease, and prevent egg and larval development. In general, turbidity tends to be low in Dutchess County streams although high-frequency sampling that would detect turbidity spikes related to storm events has generally not been carried out.
Water temperature is one of the most important variables in aquatic ecology. Temperature affects the movement of molecules, fluid dynamics, and metabolic rates of organisms as well as a host of other processes. In addition to having its own potential “toxic” effect (such as when the temperature is too high), temperature affects the solubility and toxicity of other parameters. Generally, the solubility of solids increases with increasing temperature, while the solubility of gases (including dissolved oxygen) decreases with higher temperatures.
In densely wooded areas where the majority of the streambed is shaded, heat transferred from air and groundwater inputs drives in-stream temperature dynamics. However, in areas that aren’t shaded, the water temperatures can rise much more quickly due to direct exposure to the sun’s radiation. Water temperatures exceeding 77 degrees Fahrenheit cannot be tolerated by brook trout; they prefer water temperatures less than 68 degrees Fahrenheit [23].
Determining whether a stream has good or bad water quality depends largely upon the end user. Water quality in Dutchess County can vary from stream to stream and mile to mile within the same stream. However, as indicated by the “snapshot” offered above, water quality in Dutchess County tends to be good, with a few exceptions. Degradation tends to not come from a direct point but results from slower changes that occur over time with land use changes that increase impervious surface cover and decrease the amount of water that infiltrates into the ground. The impacts of these activities on our water resources reverberate throughout the system. They are most obvious during flood events that cause the loss of property and infrastructure, but effects are also evident during low flow periods when the stream is over-wide and shallow, unable to support a vibrant coldwater fishery in affected segments.
Water Quality Standards
The federal and New York State governments have developed water quality and purity standards to monitor and protect waterbodies. The Federal Water Pollution Control Act of 1972, as amended (and subsequently called the Clean Water Act), imposes strict standards on water quality and pollutant levels. Part 701 of the 1974 New York Environmental Conservation Laws (6 NYCRR) outlines the water quality and priority classifications and standards for New York State waterbodies.
NYSDEC Stream Classification and Impaired Water Body ListAll waters in New York State are given a class and standard designation based on present quality and best usage for that water body [24]. In the case of streams and rivers, the classifications are assigned to specific segments of a watercourse. The New York State DEC stream classification system includes the following designations:
Stream Classifications: Class / Best Use- AA / Drinking (after disinfection), Bathing and Fishing
- AA / Drinking (after disinfection and approved treatment), Bathing and Fishing
- B / Bathing and Fishing
- Class / Fishing- Propagation and Survival
- D / Fishing- Survival
Additional designations of “T” or “TS” can be added to Class A, B, or C stream if a water body has sufficient amounts of dissolved oxygen to support trout (T) and/or trout spawning (TS). Water bodies that are designated as “C (T)” or higher (e.g., “C (TS)”, “B”, or “A”) are collectively referred to as “protected streams,” and are subject to additional regulations and require a State permit for disturbance of the bed or banks.
The New York State DEC also applies standards that correspond to these classifications when reviewing stream disturbance or pollutant discharge permit applications. This is to prevent the existing water quality from deteriorating. Some of these standards are described in numerical form whereas others are in narrative form. The details of these standards can be found in New York Codes, Rules, and Regulations, Title 6, Department of Environmental Conservation, Chapter X, Division of Water, Part 703, Surface Water and Groundwater Quality Standards and Groundwater Effluent Limitations.
Most of the streams, rivers, lakes, and ponds within Dutchess County are Class B, C, or D. Some of the more significant AA and A streams and lakes are listed below:
- Clove Creek - at Fishkill water supply –
- Crum Elbow Creek and tributaries - upstream of Hyde Park Fire and Water District intake –
- Ellis Pond - Fishkill Creek - at Beacon water supply –
- Gardiner Hollow Brook - at Green Haven State Prison water supply –
- Green Mountain Lake –
- Hiller Brook and tributaries - at Pawling Village water supply. –
- Indian Kill - at Staatsburg water supply –
- Long-Pond – upstream end of H-101-18-11 and 0.6 mile northwest of Schultzville.
- Pawling Reservoir –
- Silver Lake – Located at upstream end of H-101-18-13 and 1.0 mile northwest of Bullshead
- Swamp River - at Harlem Valley Hospital water supply –
- Ten Mile River, wells, stream, and tributaries - at Dover Plains auxiliary water supply –
- Tributaries of Cargill Reservoir
A complete list of the classifications for Dutchess County waterbodies and stream segments can be found at Department of Environmental Conservation Regulations, Chapter X, Part 857 for the Wappinger Creek Basin and at Part 862 for the other drainages entering the Hudson River.
Waterbody classifications affect, but do not totally restrict, land uses and discharges along waterways. If wastes are treated to satisfy the appropriate standards, they can be discharged under permit (see below). The standards protect the rights and property values of landowners along water courses by protecting them from water pollution. Stream classifications are periodically revised by the New York State Department of Environmental Conservation. Public hearings are an integral part of the reclassification process.
Periodically, the DEC publishes the Priority Waterbodies List (PWL), which includes a list of water bodies that do not meet their designated “best use” classification. A data sheet that describes the conditions, causes, and sources of water quality degradation for each of the respective listings is included in the PWL. The PWL is used by the DEC and other agencies as a primary resource for water resources management and funding. You can access the classification of your stream on the Dutchess Environmental Mapper.
The PWL is included within the Waterbody Inventory (WI), a comprehensive inventory of all the waterbodies in New York State that is maintained by the DEC. The purpose of the WI/PWL is to characterize the extent to which designated water uses are being supported, to identify waterbodies that have been impaired, and to track efforts to restore impaired waterbodies to their designated uses. The WI is part of an overall program known at the Comprehensive Assessment Strategy (CAS) conducted through an ongoing series of rotating basin surveys. The DEC has assigned all of the waterbodies in NYS to one of 17 designated drainage basins. The waterbodies of Dutchess County, including those that drain to the Housatonic River, are part of the Lower Hudson River Basin.
Each year two to three of the drainage basins are reassessed, allowing all 17 to be reevaluated every five years. The reassessments are conducted over a two-year period and involve an examination of data on biomonitoring, water and sediment chemistry, and sediment toxicity as well as any data generated by site- or problem-specific monitoring activities. The primary question that is addressed in each review is whether the waterbodies support their designated uses such as public bathing, drinking water, support of aquatic life, etc. Based on the data review by DEC staff and personnel from other cooperating agencies, the waterbodies (or segments thereof) are classified into one of six categories: impaired waters, waters with minor impacts, threatened waterbodies, waterbodies with impacts needing verification, waterbodies with no known impacts, and unassessed waterbodies. Waterbodies that are classified in one of the first three categories are assigned to the Priority Waterbodies List (PWL).
According to the 2008 Lower Hudson River Basin WI/PWL Report, most waterbodies in Dutchess County have not been assessed. For those waterbodies that were assessed, impairment was documented at Hillside Lake, Wappingers Lake, and segments of the Fall Kill and its tributaries. Minor impacts were observed at lower Fishkill Creek, Sylvan Lake, and segments of the Casperkill Creek, the Landsman Kill, the Rhinebeck Kill, and their respective tributaries.
Discharges of stormwater and wastewater are regulated in New York State under the State Pollutant Discharge Elimination System (SPDES). The original intent of this legislation was to control point sources of pollution such as industrial outfalls and discharges from publicly owned wastewater treatment plants. Operators of these facilities are required to obtain permits that specify the maximum quantity of wastewater to be discharged into the waters of New York State. The law also imposes upper limits for specific categories of pollutants. When the federal CWA was amended in 1987, a set of mandated requirements known as Phase I was added to address discharges from additional types of industrial activities, medium and large Municipal Separate Storm Sewer Systems (MS4s) and construction activity disturbing more than five acres of soil. These sources were also required to obtain SPDES permits.
Under the more recent Phase II of the CWA, efforts were intensified to reduce pollutant loading from construction sites of one acre or larger and from municipal stormwater conveyance systems. Municipalities that met certain criteria of population size (>50,000) and population density (>1000 people per square mile) were automatically designated as MS4s. As of January 2010, these communities are required to develop and fully implement a Stormwater Pollution Prevention Plan in order to receive a general permit allowing them to discharge stormwater into the waters of New York State. The communities in Dutchess County that were automatically designated as MS4s are listed as follows: Beacon (C), Beekman (T), East Fishkill (T), Fishkill (V) and (T), Hyde Park (T), LaGrange (T), Pleasant Valley (T), Poughkeepsie (C) and (T), Union Vale (T), Wappinger (T), Wappingers Falls (V), where T, C, and V refer to town, city, and village respectively. Because they have lands that fall within the New York City Department of Environmental Protection East of Hudson watershed, additional parts of Pawling (T) and (V), Beekman (T), and East Fishkill (T) are also required to comply with the Phase II regulations for MS4s.
Water Quantity
Water Quantity – Too much yields flooding
While having access to plentiful sources of water is essential for thriving communities, too much water can present challenges. Flooding is a major environmental issue that arises when there is an excess of water, often caused by heavy rainfall, rapid snowmelt, or storm surges. When water exceeds the capacity of rivers, lakes, or drainage systems, it can overflow onto land, inundating homes, infrastructure, and farmland. Floods can cause significant damage, displacing communities, destroying crops, and leading to the loss of life and property. Additionally, floods can contaminate water supplies, spreading pollutants and disease, further complicating recovery efforts.
Managing excessive water is a complex issue because it involves balancing the needs of water conservation with the risk of flooding. Urbanization and deforestation have worsened the situation by reducing natural drainage systems, such as wetlands and forests, which help absorb and filter excess water. Areas with dense, impermeable surfaces like roads and buildings prevent water from soaking into the ground, increasing runoff and flood risks. Effective flood management requires a combination of engineering solutions along with sustainable land-use practices that can help control water flow and reduce the impact of extreme weather events.
Those most impacted by flooding: Flooding poses a significant threat to communities, ecosystems, and economies, often causing widespread damage and disruption. Excessive water from heavy rains, snowmelt, or storms can impact a wide range of stakeholders, creating challenges for both immediate response and long-term recovery. Identifying who is affected and understanding how helps improve preparedness and resilience against the destructive effects of flooding. The main impacted stakeholders during a flood include:
- Water Utilities, Public Water Systems, and Municipalities: Floods can overwhelm public water systems, leading to contamination of water supplies and significant damage to infrastructure. Municipalities may face challenges in providing clean drinking water, dealing with sewage overflow, and managing stormwater runoff, often requiring emergency interventions.
- Farmers and Agricultural Producers: Flooding can destroy crops, wash away soil, and inundate farmland, leading to crop failure, financial losses, and food shortages.
- Private Property Owners and Households: Individuals whose homes are located in flood-prone areas are at risk of property damage or destruction. Floodwaters can destroy homes, cause displacement, and lead to long-term financial hardship for affected residents, as well as disruptions in daily life due to the loss of essential services.
- Ecosystems and Wildlife: Flooding can disrupt ecosystems by altering habitats, eroding soil, and spreading contaminants. Aquatic species may be displaced, and terrestrial wildlife may struggle to survive as floodwaters destroy forests, wetlands, and other vital environments.
- Governments and Policymakers: Governments are responsible for coordinating flood response, implementing flood prevention strategies, and managing disaster relief efforts. They also face economic pressures, including funding for recovery efforts, infrastructure rebuilding, and aiding those affected by flooding.
- Businesses and Industries: Flooding can severely disrupt businesses, especially those in flood-prone regions, by damaging buildings, inventory, and infrastructure. Industries dependent on transportation, manufacturing, and supply chains can suffer from delays, reduced productivity, and financial losses due to flooding.
- Emergency Responders: Emergency response teams play a crucial role during floods by conducting rescue operations, providing shelter, and delivering aid to affected communities. Additionally, flood conditions often increase the risk of other disasters, such as landslides or disease outbreaks, which further strain emergency response efforts.
Water Quantity – Too little yields drought
Of course, not having access to enough water is another major challenge for communities. Drought is a significant environmental problem that occurs when there is a prolonged period of below-average rainfall, leading to water shortages. Without enough water, crops fail, livestock suffer, and communities can experience severe water scarcity. Droughts can lead to poor crop yields, economic losses, and food shortages, as agricultural production heavily depends on reliable water supplies. In addition, dry conditions increase the risk of wildfires and can severely stress ecosystems, threatening wildlife and plant life that depend on regular water availability.
Managing drought involves addressing both immediate and long-term needs for water conservation and sustainable usage. In many areas, overuse of water resources, such as over-extraction from rivers and groundwater, has exacerbated the problem. Climate change is also predicted to make droughts more frequent and intense, further straining already limited water supplies. Solutions to drought require careful management of available water, investment in technologies for efficient water use, and long-term strategies like rainwater harvesting and the restoration of natural water systems to ensure resilience in the face of increasingly erratic weather patterns.
Those most impacted by drought: Droughts pose a serious threat to many aspects of life, impacting not just the environment but also various sectors of society. The scarcity of water during these times affects a wide range of stakeholders, from individuals and businesses to entire ecosystems. Understanding who is impacted and how helps us better prepare for and respond to the challenges posed by prolonged dry conditions. The main impacted stakeholders during a drought include:
- Water Utilities, Public Water Systems, and Municipalities: Drought conditions reduce the available water supply for cities and towns, making it challenging to meet the needs of residents, businesses, and industries. Public water systems may experience water shortages, leading to restrictions, increased costs, and the need for emergency measures like water rationing.
- Farmers and Agricultural Producers: Drought can devastate crops and reduce the availability of water for irrigation, leading to significant financial losses, food shortages, and disruptions in the agricultural supply chain. Livestock may also suffer from water and food scarcity, further compounding the problem.
- Private Well Owners: In rural and suburban areas, individuals who rely on private wells for water can be directly impacted by drought, as lower water tables can lead to wells running dry. This forces residents to seek alternative water sources, sometimes at significant cost and inconvenience.
- Ecosystems and Wildlife: Drought can disrupt ecosystems by reducing water availability for plants and animals. Aquatic habitats may dry up, and species dependent on consistent water sources may face extinction or displacement.
- Governments and Policymakers: Governments are responsible for coordinating drought response efforts, implementing water management policies, and providing relief. They also face economic impacts, including the cost of disaster relief, agricultural subsidies, and infrastructure investments to mitigate water scarcity.
- Businesses and Industries: Industries reliant on water, such as manufacturing, energy production (especially hydroelectric power), and tourism, can face disruptions. Drought can lead to supply chain issues, higher operating costs, and reduced productivity.
- Emergency Responders: During a drought, emergency response teams may need to provide critical services such as water deliveries to affected communities, organize relief efforts, and help mitigate the effects of water shortages. Additionally, drought conditions increase the risk of wildfires, which can lead to further demands on emergency services for firefighting and evacuations, putting additional strain on both resources and affected populations. These organizations play a vital role in supporting those most vulnerable to the impacts of drought, especially in areas with limited access to water resources.
Flood & Drought Monitoring Resources
- National Integrated Drought Information System
- NYS DEC Current Drought Conditions map
- USGS Hydrologic Conditions Mapper
- USGS – New York Groundwater Watch
- Hudson Valley Weather
- Dutchess County water monitoring data:
- USGS Gauges
- Fishkill Watershed Stage Height Monitors
Flooding & Drought Preparedness & Response
- Water Conservation: Water conservation is essential for ensuring a sustainable supply of freshwater for future generations, as it helps reduce the strain on natural water resources. By adopting efficient practices and technologies, individuals, businesses, and governments can minimize water waste and protect vital ecosystems while maintaining adequate supplies for essential needs. For some ideas on how better stormwater management can help us handle the swings of extreme weather, check out the Planning Department’s Flooding & Drought newsletter article.
- Dutchess County Department of Emergency Response
- New York State Disaster Preparedness Commission
- Well Drilling/Rehabilitation
- NYS Certified Well Drillers
- Dutchess County Well Permit Process (link pending)
- Design Standards for New Wells
- NYS Certified Bulk Water Facilities
Water Resource Challenges & Threats
The rich hydrology of Dutchess County has historically provided adequate water to meet community needs. However, human interactions with the land introduce threats to all of the county's water resources through changes in surface water runoff, the reduction of groundwater infiltration, water contamination, and soil erosion. In many ways, climate change is exacerbating these threats and creating new stresses.
Surface WaterAs human demands for water increase or groundwater recharge decreases, there is the potential for inadequate flow of water in streams during dry periods. Low flows can lead to high water temperatures, inadequate dissolved oxygen levels, and restrictions on movements of fish and other aquatic organisms. Efforts to establish minimal environmental flows have developed procedures to determine how much water must be left in a channel to ensure good habitat value and ecological functioning.
GroundwaterNon-point source contaminant sources pose a new challenge to communities and regulators. Where wells and septic systems are in use, well water quality can suffer if not buffered by adequate recharge. The recharge rates presented in Dutchess County Aquifer Recharge Rates & Sustainable Septic System Density study have been used to recommend minimum average parcel sizes for homes using individual wells and septic systems. Analysis of the 250 domestic well water samples discussed above suggests that nitrate concentrations detected in groundwater wells show a greater incidence of higher levels when near clusters of septic systems.
Sodium and chloride concentrations recorded in the 250 domestic well samples also can be higher more often; mostly likely due to the proximity of the parcels to roads. USGS analysis of sewered and unsewered watersheds in Putnam and Westchester Counties verified that there were few differences in sodium chloride concentrations in groundwater between watersheds with or without septic systems, suggesting that road salt rather than water softener discharges to septic systems are the dominant source of salt in groundwater.
Dutchess County’s aquifers are vulnerable to contamination from sources other than septic systems and roads, including a host of regulated and some remaining unregulated land-use practices. Traditional sources of recognized groundwater contamination such as landfills, leaking petroleum or chemical storage tanks, both accidental and intentional illegal discharges, and heavy uses of fertilizers continue to contribute to the risk of aquifer contamination.
Other sanitary waste components such as pharmaceutical residues and personal care chemicals may also be present in groundwater near septic systems. Recommended parcel sizes, based on hydrologic soil group and aquifer recharge ensure a greater measure of dilution of such discharges from surrounding unimpacted groundwater but desirable contaminant dilution ratios have not been developed since no human health or aquatic health standards are available.
Many cases of groundwater pollution have appeared in recent years. The most common pollutants fall into distinct categories:
- road de-icing salts (sodium chloride) particularly at bottoms of hills or ends of cul-de-sacs where salt residues can accumulate as a result of heavy application or plowing or within settlement areas where road networks are particularly dense
- organic solvents (trichloroethylene, perchloroethylene, or carbon tetrachloride) from illegal dump sites, industrial sites, and sometimes from household products
- fertilizers
- petroleum products (gasoline and heating fuel) from spills, leaking tanks, and pavement runoff
- septic system discharges
As development pressures increase, corresponding pressures to fill, drain, or build in wetlands also increase. Wetlands are not suitable locations for landfills, basements, septic systems, or other structures and uses that function poorly in wet soils or destroy natural wetland functions.
Concern about the destruction of wetland resources led to the passage of the New York State Freshwater Wetlands Act in 1975. This act requires permits for all non-agricultural activities that could change the quality of wetlands 12.4 acres or larger and smaller wetlands of unusual local importance. It also requires the State Department of Environmental Conservation to inventory and evaluate the wetlands of the state. The act applies to 4.4 percent of Dutchess County and approximately 70 percent of the county's total wetland acreage.
Water and Climate ChangeA changing climate is predicted to affect the quantity, quality, and habitat suitability of surface water. The intensity of annual precipitation is expected to increase in the coming years, with implications for water resources. More detailed information can be found in the Climate Change section of the NRI.
Flooding hazards are predicted to increase as climate conditions continue to change. Areas indicated in the Dutchess County Environmental Mapper. as 100-year floodplains will be in particular risk, but other areas may be affected as flooding in any area will depend on the intensity and timing of precipitation events. Historically, large floods in the county have been known to damage infrastructure, destroy crops and wash away agricultural soils, carry pollutants and large volumes of sediments into streams. Much of the water volume from these large events will run off quickly into streams and be unavailable for recharging groundwater.
Flood dynamics play a large role in determining the shape, or morphology, of stream channels and the hazards associated with land uses on the banks and in the floodplain. For example, applications for stream disturbance permits (from New York State Department of Environmental Conservation (NYS DEC)) typically increase following floods as landowners and municipalities attempt to repair damage caused by flooding.
More extended and more frequent droughts are also predicted, and are likely to affect public water supplies, private drinking water wells, and farm ponds for watering livestock, as well as streams, other natural habitats, and native plants and animals.
More extreme floods and droughts, as well as increases in water temperatures, are likely to adversely impact populations of trout and other sensitive stream organisms that rely on cool, clear streams and unsilted stream substrates.
Water Resource Conservation, Implications, and Recommendations
Dutchess County’s surface water and groundwater supplies support a large human population and sustain a diverse natural resource base. The abundance of water in the county has made it easy to take these resources for granted, and to treat land and water use as if they were unrelated. In recent years, however, the interdependence of land use, water quality, and water quantity has become obvious as reports of water shortages, groundwater contamination, and drainage problems have multiplied. It is now clear that allowing water supplies to be damaged by overuse and pollution can threaten the county's environmental, social, and economic well-being. Well-integrated land and water management plans are needed to restore water supplies that are showing signs of misuse, and to prevent further damage from occurring.
Watershed landowners have direct influence over land uses in the watershed and directly benefit by assisting in the protection and restoration of their water resources. There are also local benefits to be derived from implementation of watershed protections measures. For example, protecting and enhancing the fishery could also benefit the economy and aesthetic values of the region. Proper watershed management can also assist in protecting infrastructure, reducing flood damages, and developing a stream stewardship ethic. Wherever you live in the watershed, what you do at your home and its surroundings can have a direct impact on your neighbor’s water resources.
General measures can be taken to conserve water resources. Future development in the stream corridor, with a resulting increase in impervious surface, may increase runoff and impair water quality. Therefore, management efforts should be focused on preventing further human-induced degradation through implementation of best management practices designed to reduce or minimize impacts. These efforts should be both direct measures such as remediating failing septic systems and upgrading sewer treatment plants (point sources of pollution), and indirect measures, such as reducing stormwater inputs, properly installing new infrastructure, and planting riparian buffers. In areas where existing infrastructure is acting to destabilize the stream or is threatened by erosion, stabilization techniques incorporating natural channel design should be employed. Reforesting the banks of Dutchess County streams, coupled with the protection of cold groundwater seeps, may help to lower summer water temperatures and enhance the fishery. Forested landscapes ensure the sustenance of groundwater resources, maintaining surface water quantity, and maintaining suitable habitat with stable banks. Maintaining forests with intact vegetation and undisturbed forest floors will benefit the county’s water resources. More detailed recommendations can be found below.
GroundwaterA range of water resource capacity planning tools can help protect groundwater resources.
- Pumping tests for new higher-capacity wells must evaluate potential impacts to streams and wetlands. Minimum flow needs of groundwater to streams and riparian wetlands should be understood and preserved by controlled pumping rates or by strategic return of treated wastewater flows.
- Stream gauging has been completed at municipal boundaries in the Harlem Valley to identify approximate stream flow growth from the aquifers in each individual town. Such gauging is needed in the Fishkill Creek and Wappinger Creek watersheds. Once available, relative shares of water contributing to stream flow by each municipality can be assigned to manage allocation for future development projects and collectively assure preserved water quantity.
- Pumping tests for new higher-capacity wells should be conducted at higher flow rates if conducted during wet periods. For example, if a test is conducted during a period with 10 percent more precipitation than normal, a 10 percent flow premium should be applied to the test as a measure to identify likely affects or reliability of the proposed well during drier periods.
- In general, higher capacity wells will be more successful if installed lower in a watershed where the well can benefit from groundwater flowing toward the well from a larger upper portion of a watershed.
- All reasonable measures should be taken to enhance recharge on sites. Stormwater measures should prioritize groundwater recharge to maximize groundwater replenishment, although no enhanced recharge should be authorized without proper pre-treatment.
- Efforts should be made to limit coverage of higher-permeability soils (Hydrologic Soil Group A B, and C where possible) and limit connections and hard stormwater conveyances between necessary impervious surfaces. Careful design considerations are needed especially where sites exceed 30 percent of connected impervious surfaces, which is the approximate limit at which groundwater recharge losses begin to reduce stream flows during dry periods.
- Disconnecting impervious surfaces and the provision of infiltration devices (with proper pre-treatment) can be mitigating strategies in such areas. Limiting areas with highly impervious surfaces is consistent with land use policy recommendations restricting the size of hamlet and town center areas to walkable distances.
- Where uses of individual wells and septic systems are expected into the foreseeable future, zoning should be adapted to ensure that average parcel sizes do not fall below those recommended, at least for soils in hydrogeologic soil group B, and preferably for hydrologic soils group C. This will help ensure availability of potable water along with the sustainable use of time-proven septic system designs.
- Adopt water protection ordinances to provide water resource quality protections where there are gaps in State or Federal regulations.
- Lay out cluster subdivisions so that undersized parcels do not inadvertently position wells and septic systems closer than those recommended above. Cluster subdivision platting layout advice is included in the model ordinance noted in the previous entry.
- Fund research and outreach on waste management programs to reduce environmental discharges of pharmaceuticals, caffeine, and personal chemical residues.
- Continue periodic regional well sampling initiatives focused on traditional and perhaps emerging contaminants of concern. Funding can be engaged efficiently by focusing on specific compounds of concern rather than sampling entire lists of constituents seldom found in groundwater samples.
De-icing activities should be refined to minimize application rates, using methods that result in minimum undissolved salt residues. Drainage improvements or snow aprons may be necessary at ends of cul-de-sacs or near the bottom of heavily salted hills. Unless proper treatment for de-icing compounds can be provided, road runoff should never be directly infiltrated into groundwater using drywells or other injection devices. This has been a standard NYS stormwater position for some time but some design firms overlook it in the interest of other water management priorities. Ongoing sampling should evaluate efficacy of such programs.
Floodplains and FloodingTo minimize flood impacts on property and infrastructure in an increasingly unpredictable climate, it is critical to plan for flooding behavior. Historically, this “planning” has emphasized attempts to constrain and control stream channels rather than planning to keep infrastructure, residences, etc. out of areas likely to flood. The results are often costly and sometimes catastrophic, such as when berms or levees fail or bridges wash out. These “control” approaches typically result in ongoing maintenance costs that can draw valuable community resources away from other projects.
Alternatively, measures can be taken to prepare for, recover from, and adapt to flooding events, often referred to as flood resilience. This can be achieved through the additional of local laws. The Department of State worked with the Department of Environmental Conservation and other partners to create the 2019 New York State produced Model Local Laws to Increase Resilience to help local governments be more resilient to sea-level rise, storm surge, and flooding. These model laws were developed from a variety of sources and should be viewed as examples to help local government officials interested in addressing resiliency issues in their municipal code.
Relevant to floodplains are the Basic Land Use Tools for Resiliency Chapter and Management of Floodplain Development chapter, which covers topics like:
- Prohibiting substantial improvements to nonconforming uses or structures in flood prone areas
- Building elevation and design requirements for elevated buildings
- Subdivision in flood-prone areas
- Management of Floodplain Development
- Limiting development in 100-Year or 500-Year floodplain
- Floodplain and wetland resource conservation overlay district
- Establishing a design flood elevation
Municipalities have the authority under State Law to enact local wetland protection so long as these laws are at least as protective as the State Law. Many local towns have passed such regulations usually with a lower size limit of an acre or less. One of the major decisions in choosing a local wetlands law to protect smaller wetlands is deciding the lower size limit that would be covered by the Law. Model Local Laws to Increase Resilience provides examples for bolstering wetland protections, and includes regulatory tools such as:
- Wetland and Watercourse Protection Measures
- Wetland Protection
- Simple Wetland Setbacks
- Wetlands Buffer
- Wetland Conservation Overlay District
- Local Freshwater Wetland Law
- Watercourse Protection
- Simple Watercourse Setbacks
- Stream-Related Zoning Standards
- Watercourse Overlay District • Local Watercourse Law
Additional Resources
- Dutchess County Government: Water Quality Monitoring and Assessment
- New York State Department of Environmental Conservation: Water Quality Standards and Classifications
- Dutchess County Watershed Management Plans:
- Casperkill Assessment Document (2009)
- Fall Kill Watershed Management Plan (2006)
- The Fall Kill Plan (2011)
- Natural Resources Management Plan For the Fishkill Creek Watershed (2005)
- Saw Kill Watershed and Flood Mitigation Assessment (2018)
- Saw Kill Watershed Source Water Protection Scorecard Recommendations (2019)
- Natural Resource Management Plan for the Wappinger Creek Watershed (2001)
- Watershed Characterization and Recommendations Report for the Wappinger Creek Watershed (2022)
- Ten Mile River Watershed Management Plan (2022)
- Hudson River Estuary Program Action Agenda (2021-2025)
- Dutchess County General Legislation, Chapter 174 Freshwater Wetlands
- New York State Freshwater Wetlands Program
- New York State Department of Environmental Conservation’s Water Webpage
- Impaired Waterbodies in New York State, NYSDEC 305b Water Quality Report, 2018
- NYS DEC List of Published Water Quality Monitoring and Assessment Reports
- New York State DEC’s Funding and Assistance for Planting Riparian Buffers
- New York State Department of State’s 2019 Model Local Laws to Increase Resilience
- New York State Department of Environmental Conservation’s 2022 Draft Stormwater Management Design Manual
References
[1] Dutchess County Water & Wastewater Authority, The Chazen Companies. “Dutchess County Aquifer Recharge Rates & Sustainable Septic System Density Recommendations.” April 2006.
[2] Dutchess County Environmental Health Sciences. Dutchess County Comprehensive Private Well Testing Initiative. 2008 and 2009
[3] Levinton, J.S. and J.R. Waldman. The Hudson River Estuary. Cambridge, MA: Cambridge University Press., 2006.
[4] Limburg, K.E. and R.E. Schmidt. Patterns of Fish Spawning in Hudson River Tributaries: Response to an Urban Gradient?. Ecology 71, 4 (1990): 1238 – 1245.
[5] Booth, D.B. “Stream Channel Incision Following Drainage Basin Urbanization.” Water Resources Bulletin 26 (1990): 407-417.
[6] Groffman, P.M., N. L. Law, K.T. Belt, L.E. Band and G.T. Fisher. Nitrogen Fluxes and Retention in Urban Watershed Ecosystems. Ecosystems 7 (2004): 393-403.
[7] CWP. Rapid Watershed Planning Handbook: A Comprehensive Guide for Managing Urbanizing Watersheds. Ellicot City, Maryland: Center for Watershed Protection, 1998.
[8] Mitsch, J.G. and J.G. Gosselink. 1993. Wetlands. New York: Van Nostrand Reinhold, 1993.
[9] Burns, David. 2006. “Assessment of In-Stream Water Quality of Hudson River Tributaries in the Rural to Urban Landscapes of Dutchess County, NY.” Millbrook, NY: Dutchess County Environmental Management Council, 2006.
[10] Environment Canada. “Road Salt.” Priority Substances List Assessment Report. Canadian Minister of Public Works and Service, 2001.
[11] Unites States Environmental Protection Agency (USEPA). “National Recommended Water Quality Criteria Tables.” Accessed 2023.
[12] Mullaney, J.R., D. L. Lorenz, A.D. Arntson, A.D. “Chloride in Groundwater and Surface Water in Areas Underlain by the Glacial Aquifer System, Northern United States.” U.S. Geological Survey Scientific Investigations Report 2009–508. Reston, VA: USGS, 2009.
[13] Kincaid, D.W. and S.E.G. Findlay. “Sources of Elevated Chloride in Local Streams: Groundwater and Soils as Potential Reservoirs.” Water Air Soil Poll. 203 (2009): 335-342.
[14] Behar, Sharon. Testing the Waters Chemical and Physical Vital Signs of a River. Montpelier, VT: River Watch Network, 1997.
[15] United States Environmental Protection Agency (USEPA). “Environmental Indicators of Water Quality in the United States.” United States EPA Report # EPA 841-R-96-002. Washington, D.C.: United States Environmental Protection Agency Office of Water, 1996.
[16] New York State Department of Environmental Conservation (NYS DEC). New York State Nutrient Standards Plan. July 7, 2011. Accessed 2023.
[17] Welsch, David J., David L. Smart, James N. Boyer, Paul Minkin, Howard C. Smith, and Tamara L. McCandless. “Forested Wetlands: Functions, Benefits, and the Use of Best Management Practices.” Radnor, PA: United States Department of Agriculture Forest Service, 1995.
[18] McCasland, M., N.M. Trautmann, R. J. Wagenet and K.S. Porter. “Nitrate: Health Effects in Drinking Water.” Cornell University Cooperative Extension Department of Natural Resources Fact Sheet. Ithaca, NY: Cornell Cooperative Extension, 1998.
[19] Smith, R.A., R.B. Alexander and K. J. Lanfear. “Stream Water Quality in the Continuous United States — Status and Trends of Selected Indicators During the 1980’s.” National Water Summary 1990-91 — Stream Water Quality, U.S. Geological Survey Water-Supply Paper 2400. Reston, VA.: U.S. Geological Survey, 1991.
[20] Unites States Environmental Protection Agency (USEPA). “Volunteer Stream Monitoring: A Methods Manual.” EPA 841-B-97-003. Washington, DC.: United States Environmental Protection Agency Office of Water, 1997.
[21] United States Environmental Protection Agency (USEPA). “A Field-Based Aquatic Life Benchmark For Conductivity In Central Appalachian Streams (Final Report).” Washington, DC, EPA/600/R-10/023F, 2011.
[22] TU. “Eastern Brook Trout: Status and Threats. Trout Unlimited Report.” Arlington, VA: Trout Unlimited, 2006.
[23] New York State Department of Environmental Conservation. “2018 Section 303(d) List of Impaired Waters Requiring a TMDL/Other Strategy.” June 2020.
Glossary
100-year floodplain: Land that is covered in water during a flood event that has a 1 percent chance of being equaled or exceeded each year.
500-year floodplain: Land that is covered in water during a flood event that has a 0.2 percent chance of being equaled or exceeded each year.
Aquifer: Underground layers of rock that are saturated with water that can be brought to the surface through natural springs or by pumping.
Atmosphere: The air surrounding and bound to the Earth.
Base flow: The portion of the streamflow that is sustained between precipitation events, fed to streams by delayed pathways.
Dissolved oxygen: A measure of how much oxygen is dissolved in the water – the amount of oxygen available to living aquatic organisms.
Drainage basin: often used interchangeably with “watershed,” the area of land that catches precipitation and drains or seeps into wetlands, streams, rivers, lakes, or groundwater.
Eutrophication: Excessive richness of nutrients in bodies of water, frequently due to runoff from the land, which causes a dense growth of plant life and death of animal life from lack of oxygen.
Floodplain: The land adjacent to the channel including the hydrologic floodplain and other lands up to an elevation based on the elevation reached by a flood peak of a given frequency.
Groundwater: Water that exists underground in saturated zones beneath the land surface.
Groundwater Recharge: A hydrologic process that occurs when local precipitation enters soil and rock horizons and infiltrates down to subsurface depths where the sediment porosity or bedrock fractures are already saturated from prior precipitation events.
Hydraulic conductivity: the ability of the fluid to pass through the pores and fractured rocks.
Infiltrate: Precipitation or water as it infuses into subsurface soils and moves into rocks through pores.
Lake: A place where surface water runoff and groundwater seepage have accumulated in a low spot, relative to the surrounding landscape.
Morphology: The size and shape of a stream.
Perennial Streams: A stream that has continuous flow of surface water throughout the year in at least parts of its catchment during seasons of normal precipitation.
Permeability: a measure of the ability of a material (such as rocks) to transmit fluids.
pH: A measure of how acidic/basic water is. The range goes from 0 – 14, with 7 being neutral.
Porosity: The percentage of the soil or rock volume that is occupied by pore space, void of material; defined by the ratio of voids to the total volume of a specimen.
Precipitation: The process where water vapor condenses in the atmosphere to form water droplets that fall to the Earth as rain, sleet, snow, hail, etc.
Runoff: Part of the water cycle that flows over land as surface water instead of being absorbed into groundwater or evaporating.
Stream: A continuous body of surface water flowing within a channel.
Sulfate: A polyatomic anion made of one sulfur atom and four oxygen atoms.
Surface flow: Precipitation that reaches a surface stream without ever passing below the soil surface.
Turbidity: The measure of relative clarity of a liquid i.e. cloudy, opaque, or thick with suspended matter.
Watershed: A land area that channels rainfall and snowmelt to creeks, streams, and rivers, and eventually to outflow points such as reservoirs, bays, and the ocean.
Watershed Boundary: The highest elevations surrounding a lake or river segment. A drop of water falling outside of the boundary will drain to another watershed.
Water Table: An underground boundary between the soil surface and the area where groundwater saturates spaces between sediments and cracks in rock.
Wetland: A distinct ecosystem that is flooded or saturated by water, either permanently or seasonally.